Past Performance Is No Guarantee of Future Results wrote:
sbeefyk2 wrote:
But think about the time scale here. If the oceans are currently rising about 4mm per year. After 100 years that's 0.4 meters. After 1,000 years that 4 meters. 4 meters can be devastating. But that's after 1,000 years with everything else remaining the same. 1,000 years from now we will likely be inhabiting another planet. Or figured out an energy source that produces virtually zero pollution. Or we'll all be dead from a nuclear holocaust.
I think too many people forget climate change is far slower than we think. The cycles are over thousands of years. Not decades. We only have data for about 100 years. Maybe a little more but it's spotty. There's no way to guess cycles that last thousands of years with only 100 years of data.
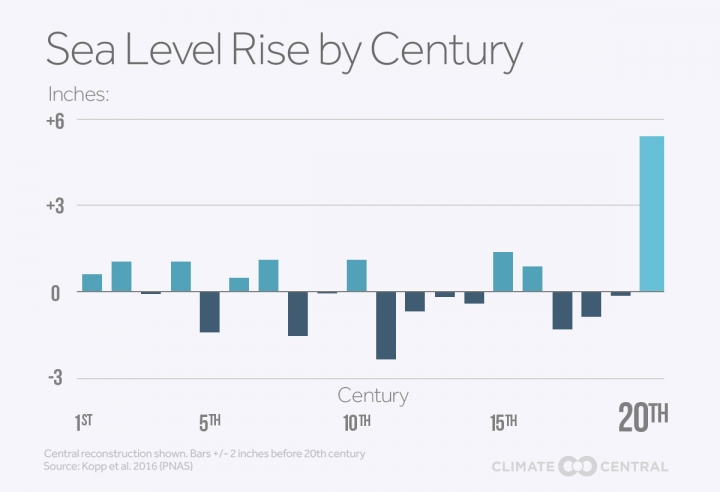
https://assets.climatecentral.org/images/made/2_22_16_John_CC_NuisanceFlooding_GlobalSLR_720_492_s_c1_c_c.jpg
I'm actually very confused over how this image was obtained.
https://www.pnas.org/content/pnas/113/11/E1434.full.pdfThis is the paper they claim to cite (for those who have access). Several things.
1) The image you posted that claims to be sourced from the paper is neither in the paper, nor the supplementary information. At best, it is taken based on some of the available data in the paper, though why they used it rather than a much more accurate diagram provided directly in the actual paper is beyond me. My favorite part is that they put the disclaimer from the authors in extremely faint text, indicating that every bar is + or - 2 inches due to variability in predictions. In short, all sea level rises could have been drops, and vice versa, with the only exception being the 10th and 20th centuries.
2) The paper is a mathematical model and is semi-empirical in nature (the authors openly indicate this). The authors repeatedly indicate comparisons and contrasts to other models, and provide a huge number of disclaimers indicating that empirical data outside of the last century is based on models rather than actual data.
3) The authors also indicate that based on their model, in the complete absence of human-derived climate change, the total sea level change in the last century would be half of what it currently is. That still leaves it at double or more the change experienced by every other century, which is actually interesting.
4) The authors indicate very specifically that the standard deviation associated with each mean measurement (all those nice little bars in that bar graph) are nearly 100% of the absolute value of the means themselves. Ex. They state that the GSL from 0 - 700 CE is 0.1 mm/year plus minus 0.1 mm/year. This means that for all non-empirical datapoints, the changes could easily range anywhere from twice as large as the given value, to values that are virtually zero. The actual paper has a graph that indicates this.
For the record, I actually DO believe in climate change. However, it is very irritating when uninformed people make commentary on it using "research" without actually understanding what the research is. The researchers themselves make absolutely no commentary beyond the actual parameters and nature of the model, because they KNOW there is variability associated with it, and admit that the community is still trying to work out inconsistencies across individual predictions. Somehow, everything they say gets taken out of context and we have doomsday predictors saying that life will end in a matter of years. We also have people like you spouting the predictions of a semi-empirical model as fact, when even the makers of the model do not claim that it is fact.