rekrunner wrote:
The Unkle wrote:
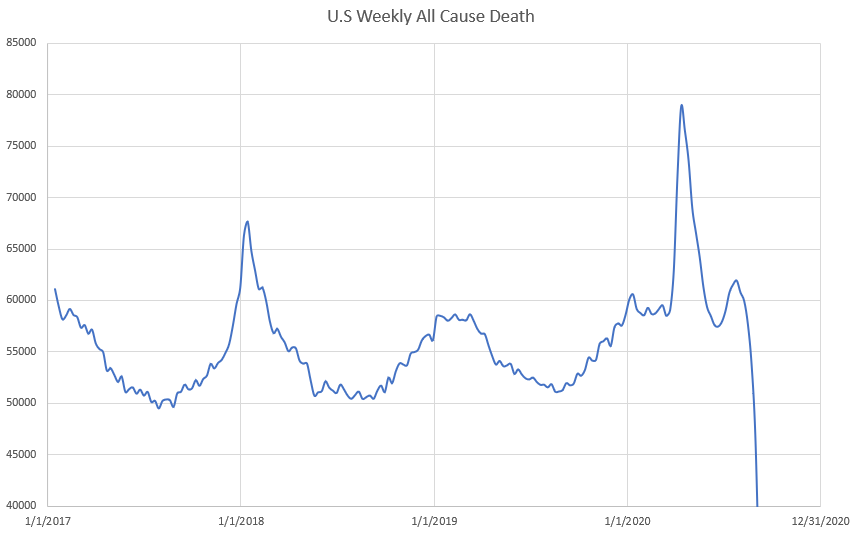
Let's analyze this chart.
At some point the deaths spiked to @ 8,000 per week from the usual 6,000 or so. But just for a short period. In fact, looks like for one week or so. So seven months since the virus = 30 weeks, with an increase in deaths of less than 2,000 per week = at most 60,000 extra deaths. IN fact, clearly less than 2,000 per week increase per the chart save for that one spike. We are told there are 200,000 covid deaths and 200,000 excess deaths. But the chart supports a number that is less than 60,000.
Looking at the left axis, don't you mean 80,000 and 60,000? Looks like you are off by a factor of 10.
I have always said that COVID 19 deaths are under reported. Looks like Unkle's calculations have deaths off by a factor of 3. Not sure I would go that high. But it is nice to see some deniers switching sides.