I asked Geoff Burns, a physiologist with the U.S. Olympic and Paralympic Committee and co-author of Joubert’s study, to run some numbers for me. The calculations are trickier at track-running speeds than they are for marathoners (for reasons explained here), but a reasonable estimate is that improving your running economy by 1 percent will increase your racing speed by about two-thirds of a percent. So a typical 4:00.0 miler in the old spikes might expect to run 3:56.8 in the new ones—“corrected for inflation,” as Burns puts it.
That's one way to do a quick and dirty ("reasonable") estimate (240*0.987 seconds). But I think it overestimates the benefit by about a second, and I'd say 3:58 is the new 4:00. My look at the World Athletics data a few days ago shows that the superspike benefits lessen at higher paces, which his estimate can't account for. It shows what has actually happened to track times.
I looked at 1000th yearly performer times at 800/1500/5000/10000 and compared seven pre-superspike years (2012-18) to 2022 (skipped covid-affected 2019 and 2020; 2021 and 2022 both superspiked years but picked the barely faster 2022 for comparison due more brands with superspikes. Would have had the same results combining 2021 and 2022 as superspike years). It's not a rigorous statistical look, but it was easy to notice that at the 1000th performer level, the data is relatively smooth year to year due to it resting on a ranked list of 999 beneath it. For example, the standard deviation of seven 1500 times from 2012-2018 was only 0.22 second, and the standard deviation of the 800 times from those years was only 0.06 second. (For comparison, if you look higher up the rankings at the100th performer level in the 1500, standard deviation for 2012-2018 is a lot higher at 0.56 second.) The 10000m times were an exception because people started using Vaporflys in 2016/2017 partway through the pre-superpike years.
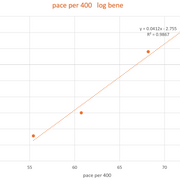
I made the assumption that that from a physics standpoint, the shoe doesn't know a runner what distance a runner is running, it's just reacting to the forces applied to it. So, I graphed the (log) benefit at different paces and came up with a (highly correlated r2=.9867) regression line, and a table representing that line.
After I took a look at the World Athletics Stats Zone in responding to a post last week on superspikes, I decided to do a deeper look at how the superspikes benefit runners at different events and therefore different paces. I...
3:58 is the new 4:00. The 0.5 second benefit at 60 second pace was rounded from 0.52 second from the regression line, but I don't want to imply greater precision that I have. And don't forget it's not the same benefit for everyone.
For fun, I'll look up what the World Athletics data shows for the 4:00 mile and give an estimate utilizing other parts of that database than what I've already used.:
80th yearly mile performer looks close to 4:00: 2012 4:01.98 2013 4:00.72 2014 4:00.01 2015 4:00.83 2016 4:01.11 2017 4:00.60 2018 3:59.24 2022 3:57.76 pre-superspike 2012-2018 average: 4:00.64. But the standard deviation is crap at 0.86 second and not usable for the way I'm doing comparisons - so skip this.
3:43.69 1500m is 4:00 mile pace, and pace is what matters to the shoe, so trying the 401st 1500m performer: 2010 3:43.70 2011 3:43.57 2012 3:42.94 2013 3:43.47 2014 3:43.45 2015 3:43.36 2016 3:43.39 2017 3:43.58 2018 3:43.69 2022 3:41.28 pre-superspikes: mean 3:43.46, standard deviation 0.23 second. That's 2.18 second difference at 1500. At the mile, 2.18/1500*1609.344=2.4 second. This aligns close to my table above (0.1 second off). But considering what I'm comparing (mean of 7 numbers to 1 number), I still prefer to round to 2 seconds.
I asked Geoff Burns, a physiologist with the U.S. Olympic and Paralympic Committee and co-author of Joubert’s study, to run some numbers for me. The calculations are trickier at track-running speeds than they are for marathoners (for reasons explained here), but a reasonable estimate is that improving your running economy by 1 percent will increase your racing speed by about two-thirds of a percent. So a typical 4:00.0 miler in the old spikes might expect to run 3:56.8 in the new ones—“corrected for inflation,” as Burns puts it.
That's one way to do a quick and dirty ("reasonable") estimate (240*0.987 seconds). But I think it overestimates the benefit by about a second, and I'd say 3:58 is the new 4:00. My look at the World Athletics data a few days ago shows that the superspike benefits lessen at higher paces, which his estimate can't account for. It shows what has actually happened to track times.
I looked at 1000th yearly performer times at 800/1500/5000/10000 and compared seven pre-superspike years (2012-18) to 2022 (skipped covid-affected 2019 and 2020; 2021 and 2022 both superspiked years but picked the barely faster 2022 for comparison due more brands with superspikes. Would have had the same results combining 2021 and 2022 as superspike years). It's not a rigorous statistical look, but it was easy to notice that at the 1000th performer level, the data is relatively smooth year to year due to it resting on a ranked list of 999 beneath it. For example, the standard deviation of seven 1500 times from 2012-2018 was only 0.22 second, and the standard deviation of the 800 times from those years was only 0.06 second. (For comparison, if you look higher up the rankings at the100th performer level in the 1500, standard deviation for 2012-2018 is a lot higher at 0.56 second.) The 10000m times were an exception because people started using Vaporflys in 2016/2017 partway through the pre-superpike years.
I made the assumption that that from a physics standpoint, the shoe doesn't know a runner what distance a runner is running, it's just reacting to the forces applied to it. So, I graphed the (log) benefit at different paces and came up with a (highly correlated r2=.9867) regression line, and a table representing that line.
3:58 is the new 4:00. The 0.5 second benefit at 60 second pace was rounded from 0.52 second from the regression line, but I don't want to imply greater precision that I have. And don't forget it's not the same benefit for everyone.
For fun, I'll look up what the World Athletics data shows for the 4:00 mile and give an estimate utilizing other parts of that database than what I've already used.:
80th yearly mile performer looks close to 4:00: 2012 4:01.98 2013 4:00.72 2014 4:00.01 2015 4:00.83 2016 4:01.11 2017 4:00.60 2018 3:59.24 2022 3:57.76 pre-superspike 2012-2018 average: 4:00.64. But the standard deviation is crap at 0.86 second and not usable for the way I'm doing comparisons - so skip this.
3:43.69 1500m is 4:00 mile pace, and pace is what matters to the shoe, so trying the 401st 1500m performer: 2010 3:43.70 2011 3:43.57 2012 3:42.94 2013 3:43.47 2014 3:43.45 2015 3:43.36 2016 3:43.39 2017 3:43.58 2018 3:43.69 2022 3:41.28 pre-superspikes: mean 3:43.46, standard deviation 0.23 second. That's 2.18 second difference at 1500. At the mile, 2.18/1500*1609.344=2.4 second. This aligns close to my table above (0.1 second off). But considering what I'm comparing (mean of 7 numbers to 1 number), I still prefer to round to 2 seconds.
Great example of why stats and science teachers hammer the point home that correlation does not equal causation.
You know what I never see in these analysis? Every sport has better athletes year over year, not allowed in distance running. Never allowed for..everyone is a drug cheat or has better shoes.
There are over 100M more Americans alone now than 1975.
Coaching is way better, way better years over years.
instant info thru Internet, guys/gals know what the marks are..how many run them, it gives folks a glimpse so much more quickly as to what is possible. You used to have to wait a month back in the day.
Pacing. most of it solid in almost every single race. I think this IS the biggest factor. Not that they never existed, but the sheer volume of them.If you are an Elite... elite HS kid, you can find at least 3 shots in multiple distances for set up races, without even disrupting your season.
If they made that much difference why isn't Ingebrightsen running..3:26 regularly by now. He rarely loses and has beaten everybody in multiple events at some point or other.
I read this piece yesterday, and found much of it soundly valid, but I never see the other factors even mentioned.
I think the shoes help..3.2 seconds at a mile.?.no way no how. I will never be convinced of that..doesn't mean I am not wrong LOL.
I asked Geoff Burns, a physiologist with the U.S. Olympic and Paralympic Committee and co-author of Joubert’s study, to run some numbers for me. The calculations are trickier at track-running speeds than they are for marathoners (for reasons explained here), but a reasonable estimate is that improving your running economy by 1 percent will increase your racing speed by about two-thirds of a percent. So a typical 4:00.0 miler in the old spikes might expect to run 3:56.8 in the new ones—“corrected for inflation,” as Burns puts it.
That's one way to do a quick and dirty ("reasonable") estimate (240*0.987 seconds). But I think it overestimates the benefit by about a second, and I'd say 3:58 is the new 4:00. My look at the World Athletics data a few days ago shows that the superspike benefits lessen at higher paces, which his estimate can't account for. It shows what has actually happened to track times.
I looked at 1000th yearly performer times at 800/1500/5000/10000 and compared seven pre-superspike years (2012-18) to 2022 (skipped covid-affected 2019 and 2020; 2021 and 2022 both superspiked years but picked the barely faster 2022 for comparison due more brands with superspikes. Would have had the same results combining 2021 and 2022 as superspike years). It's not a rigorous statistical look, but it was easy to notice that at the 1000th performer level, the data is relatively smooth year to year due to it resting on a ranked list of 999 beneath it. For example, the standard deviation of seven 1500 times from 2012-2018 was only 0.22 second, and the standard deviation of the 800 times from those years was only 0.06 second. (For comparison, if you look higher up the rankings at the100th performer level in the 1500, standard deviation for 2012-2018 is a lot higher at 0.56 second.) The 10000m times were an exception because people started using Vaporflys in 2016/2017 partway through the pre-superpike years.
I made the assumption that that from a physics standpoint, the shoe doesn't know a runner what distance a runner is running, it's just reacting to the forces applied to it. So, I graphed the (log) benefit at different paces and came up with a (highly correlated r2=.9867) regression line, and a table representing that line.
3:58 is the new 4:00. The 0.5 second benefit at 60 second pace was rounded from 0.52 second from the regression line, but I don't want to imply greater precision that I have. And don't forget it's not the same benefit for everyone.
For fun, I'll look up what the World Athletics data shows for the 4:00 mile and give an estimate utilizing other parts of that database than what I've already used.:
80th yearly mile performer looks close to 4:00: 2012 4:01.98 2013 4:00.72 2014 4:00.01 2015 4:00.83 2016 4:01.11 2017 4:00.60 2018 3:59.24 2022 3:57.76 pre-superspike 2012-2018 average: 4:00.64. But the standard deviation is crap at 0.86 second and not usable for the way I'm doing comparisons - so skip this.
3:43.69 1500m is 4:00 mile pace, and pace is what matters to the shoe, so trying the 401st 1500m performer: 2010 3:43.70 2011 3:43.57 2012 3:42.94 2013 3:43.47 2014 3:43.45 2015 3:43.36 2016 3:43.39 2017 3:43.58 2018 3:43.69 2022 3:41.28 pre-superspikes: mean 3:43.46, standard deviation 0.23 second. That's 2.18 second difference at 1500. At the mile, 2.18/1500*1609.344=2.4 second. This aligns close to my table above (0.1 second off). But considering what I'm comparing (mean of 7 numbers to 1 number), I still prefer to round to 2 seconds.
it if you compare the 10th & 15th best performer each year there is no change in the last 20 years.
I asked Geoff Burns, a physiologist with the U.S. Olympic and Paralympic Committee and co-author of Joubert’s study, to run some numbers for me. The calculations are trickier at track-running speeds than they are for marathoners (for reasons explained here), but a reasonable estimate is that improving your running economy by 1 percent will increase your racing speed by about two-thirds of a percent. So a typical 4:00.0 miler in the old spikes might expect to run 3:56.8 in the new ones—“corrected for inflation,” as Burns puts it.
That's one way to do a quick and dirty ("reasonable") estimate (240*0.987 seconds). But I think it overestimates the benefit by about a second, and I'd say 3:58 is the new 4:00. My look at the World Athletics data a few days ago shows that the superspike benefits lessen at higher paces, which his estimate can't account for. It shows what has actually happened to track times.
I looked at 1000th yearly performer times at 800/1500/5000/10000 and compared seven pre-superspike years (2012-18) to 2022 (skipped covid-affected 2019 and 2020; 2021 and 2022 both superspiked years but picked the barely faster 2022 for comparison due more brands with superspikes. Would have had the same results combining 2021 and 2022 as superspike years). It's not a rigorous statistical look, but it was easy to notice that at the 1000th performer level, the data is relatively smooth year to year due to it resting on a ranked list of 999 beneath it. For example, the standard deviation of seven 1500 times from 2012-2018 was only 0.22 second, and the standard deviation of the 800 times from those years was only 0.06 second. (For comparison, if you look higher up the rankings at the100th performer level in the 1500, standard deviation for 2012-2018 is a lot higher at 0.56 second.) The 10000m times were an exception because people started using Vaporflys in 2016/2017 partway through the pre-superpike years.
I made the assumption that that from a physics standpoint, the shoe doesn't know a runner what distance a runner is running, it's just reacting to the forces applied to it. So, I graphed the (log) benefit at different paces and came up with a (highly correlated r2=.9867) regression line, and a table representing that line.
3:58 is the new 4:00. The 0.5 second benefit at 60 second pace was rounded from 0.52 second from the regression line, but I don't want to imply greater precision that I have. And don't forget it's not the same benefit for everyone.
For fun, I'll look up what the World Athletics data shows for the 4:00 mile and give an estimate utilizing other parts of that database than what I've already used.:
80th yearly mile performer looks close to 4:00: 2012 4:01.98 2013 4:00.72 2014 4:00.01 2015 4:00.83 2016 4:01.11 2017 4:00.60 2018 3:59.24 2022 3:57.76 pre-superspike 2012-2018 average: 4:00.64. But the standard deviation is crap at 0.86 second and not usable for the way I'm doing comparisons - so skip this.
3:43.69 1500m is 4:00 mile pace, and pace is what matters to the shoe, so trying the 401st 1500m performer: 2010 3:43.70 2011 3:43.57 2012 3:42.94 2013 3:43.47 2014 3:43.45 2015 3:43.36 2016 3:43.39 2017 3:43.58 2018 3:43.69 2022 3:41.28 pre-superspikes: mean 3:43.46, standard deviation 0.23 second. That's 2.18 second difference at 1500. At the mile, 2.18/1500*1609.344=2.4 second. This aligns close to my table above (0.1 second off). But considering what I'm comparing (mean of 7 numbers to 1 number), I still prefer to round to 2 seconds.
Your detailed analysis is painstakingly done and complex, and appreciated.
But I am missing something. Isn't this correct?A 4:00.00 mile would equate to 3:42.18 for 1,500? Not that 3:43.x you mentioned?
I asked Geoff Burns, a physiologist with the U.S. Olympic and Paralympic Committee and co-author of Joubert’s study, to run some numbers for me. The calculations are trickier at track-running speeds than they are for marathoners (for reasons explained here), but a reasonable estimate is that improving your running economy by 1 percent will increase your racing speed by about two-thirds of a percent. So a typical 4:00.0 miler in the old spikes might expect to run 3:56.8 in the new ones—“corrected for inflation,” as Burns puts it.
That's one way to do a quick and dirty ("reasonable") estimate (240*0.987 seconds). But I think it overestimates the benefit by about a second, and I'd say 3:58 is the new 4:00. My look at the World Athletics data a few days ago shows that the superspike benefits lessen at higher paces, which his estimate can't account for. It shows what has actually happened to track times.
I looked at 1000th yearly performer times at 800/1500/5000/10000 and compared seven pre-superspike years (2012-18) to 2022 (skipped covid-affected 2019 and 2020; 2021 and 2022 both superspiked years but picked the barely faster 2022 for comparison due more brands with superspikes. Would have had the same results combining 2021 and 2022 as superspike years). It's not a rigorous statistical look, but it was easy to notice that at the 1000th performer level, the data is relatively smooth year to year due to it resting on a ranked list of 999 beneath it. For example, the standard deviation of seven 1500 times from 2012-2018 was only 0.22 second, and the standard deviation of the 800 times from those years was only 0.06 second. (For comparison, if you look higher up the rankings at the100th performer level in the 1500, standard deviation for 2012-2018 is a lot higher at 0.56 second.) The 10000m times were an exception because people started using Vaporflys in 2016/2017 partway through the pre-superpike years.
I made the assumption that that from a physics standpoint, the shoe doesn't know a runner what distance a runner is running, it's just reacting to the forces applied to it. So, I graphed the (log) benefit at different paces and came up with a (highly correlated r2=.9867) regression line, and a table representing that line.
3:58 is the new 4:00. The 0.5 second benefit at 60 second pace was rounded from 0.52 second from the regression line, but I don't want to imply greater precision that I have. And don't forget it's not the same benefit for everyone.
For fun, I'll look up what the World Athletics data shows for the 4:00 mile and give an estimate utilizing other parts of that database than what I've already used.:
80th yearly mile performer looks close to 4:00: 2012 4:01.98 2013 4:00.72 2014 4:00.01 2015 4:00.83 2016 4:01.11 2017 4:00.60 2018 3:59.24 2022 3:57.76 pre-superspike 2012-2018 average: 4:00.64. But the standard deviation is crap at 0.86 second and not usable for the way I'm doing comparisons - so skip this.
3:43.69 1500m is 4:00 mile pace, and pace is what matters to the shoe, so trying the 401st 1500m performer: 2010 3:43.70 2011 3:43.57 2012 3:42.94 2013 3:43.47 2014 3:43.45 2015 3:43.36 2016 3:43.39 2017 3:43.58 2018 3:43.69 2022 3:41.28 pre-superspikes: mean 3:43.46, standard deviation 0.23 second. That's 2.18 second difference at 1500. At the mile, 2.18/1500*1609.344=2.4 second. This aligns close to my table above (0.1 second off). But considering what I'm comparing (mean of 7 numbers to 1 number), I still prefer to round to 2 seconds.
Another way to look at it. in 2019, 35 NCAA runners ran sub 4. In 2023, 35 NCAA runners ran 3:56.9 or faster.
Racing at 4 min per mile pace is 15 miles per hour, and as speed increases so does wind resistance. The advantage of of the new shoes is easily eclipsed by running in the pack, reducing wind resistance, and saving energy.
I’m not saying the shoes aren’t slightly better than 20 years ago (that’s arguable on the track), but that the time savings realized by the shoes is less than that of smart racing tactics.
The superspikes provide AT LEAST 3 seconds per mile for every distance. The fact that EVERY sub 4, sub 14, etc. runner is wearing them is all the proof you need. People aren't spending 150 dollars on shoes that don't help at all (like some morons claim).
There's literally NOBODY at the top level who isn't using them. You'd think there'd be people that are old school and don't want the extra assistance. There's always runners that want to make things more challenging than they are (running barefoot, ultra marathons, blue jean mile, beer mile).
The elite athletes won't even pretend like the shoes don't make a massive difference.
That's one way to do a quick and dirty ("reasonable") estimate (240*0.987 seconds). But I think it overestimates the benefit by about a second, and I'd say 3:58 is the new 4:00. My look at the World Athletics data a few days ago shows that the superspike benefits lessen at higher paces, which his estimate can't account for. It shows what has actually happened to track times.
I looked at 1000th yearly performer times at 800/1500/5000/10000 and compared seven pre-superspike years (2012-18) to 2022 (skipped covid-affected 2019 and 2020; 2021 and 2022 both superspiked years but picked the barely faster 2022 for comparison due more brands with superspikes. Would have had the same results combining 2021 and 2022 as superspike years). It's not a rigorous statistical look, but it was easy to notice that at the 1000th performer level, the data is relatively smooth year to year due to it resting on a ranked list of 999 beneath it. For example, the standard deviation of seven 1500 times from 2012-2018 was only 0.22 second, and the standard deviation of the 800 times from those years was only 0.06 second. (For comparison, if you look higher up the rankings at the100th performer level in the 1500, standard deviation for 2012-2018 is a lot higher at 0.56 second.) The 10000m times were an exception because people started using Vaporflys in 2016/2017 partway through the pre-superpike years.
I made the assumption that that from a physics standpoint, the shoe doesn't know a runner what distance a runner is running, it's just reacting to the forces applied to it. So, I graphed the (log) benefit at different paces and came up with a (highly correlated r2=.9867) regression line, and a table representing that line.
3:58 is the new 4:00. The 0.5 second benefit at 60 second pace was rounded from 0.52 second from the regression line, but I don't want to imply greater precision that I have. And don't forget it's not the same benefit for everyone.
For fun, I'll look up what the World Athletics data shows for the 4:00 mile and give an estimate utilizing other parts of that database than what I've already used.:
80th yearly mile performer looks close to 4:00: 2012 4:01.98 2013 4:00.72 2014 4:00.01 2015 4:00.83 2016 4:01.11 2017 4:00.60 2018 3:59.24 2022 3:57.76 pre-superspike 2012-2018 average: 4:00.64. But the standard deviation is crap at 0.86 second and not usable for the way I'm doing comparisons - so skip this.
3:43.69 1500m is 4:00 mile pace, and pace is what matters to the shoe, so trying the 401st 1500m performer: 2010 3:43.70 2011 3:43.57 2012 3:42.94 2013 3:43.47 2014 3:43.45 2015 3:43.36 2016 3:43.39 2017 3:43.58 2018 3:43.69 2022 3:41.28 pre-superspikes: mean 3:43.46, standard deviation 0.23 second. That's 2.18 second difference at 1500. At the mile, 2.18/1500*1609.344=2.4 second. This aligns close to my table above (0.1 second off). But considering what I'm comparing (mean of 7 numbers to 1 number), I still prefer to round to 2 seconds.
Another way to look at it. in 2019, 35 NCAA runners ran sub 4. In 2023, 35 NCAA runners ran 3:56.9 or faster.
You cannot even compare those two sample sizes. Do you know how many more 23-24-25 year olds were running in 2023 vs 2019..? Check it out thru IAAF site and others.
That's one way to do a quick and dirty ("reasonable") estimate (240*0.987 seconds). But I think it overestimates the benefit by about a second, and I'd say 3:58 is the new 4:00. My look at the World Athletics data a few days ago shows that the superspike benefits lessen at higher paces, which his estimate can't account for. It shows what has actually happened to track times.
I looked at 1000th yearly performer times at 800/1500/5000/10000 and compared seven pre-superspike years (2012-18) to 2022 (skipped covid-affected 2019 and 2020; 2021 and 2022 both superspiked years but picked the barely faster 2022 for comparison due more brands with superspikes. Would have had the same results combining 2021 and 2022 as superspike years). It's not a rigorous statistical look, but it was easy to notice that at the 1000th performer level, the data is relatively smooth year to year due to it resting on a ranked list of 999 beneath it. For example, the standard deviation of seven 1500 times from 2012-2018 was only 0.22 second, and the standard deviation of the 800 times from those years was only 0.06 second. (For comparison, if you look higher up the rankings at the100th performer level in the 1500, standard deviation for 2012-2018 is a lot higher at 0.56 second.) The 10000m times were an exception because people started using Vaporflys in 2016/2017 partway through the pre-superpike years.
I made the assumption that that from a physics standpoint, the shoe doesn't know a runner what distance a runner is running, it's just reacting to the forces applied to it. So, I graphed the (log) benefit at different paces and came up with a (highly correlated r2=.9867) regression line, and a table representing that line.
3:58 is the new 4:00. The 0.5 second benefit at 60 second pace was rounded from 0.52 second from the regression line, but I don't want to imply greater precision that I have. And don't forget it's not the same benefit for everyone.
For fun, I'll look up what the World Athletics data shows for the 4:00 mile and give an estimate utilizing other parts of that database than what I've already used.:
80th yearly mile performer looks close to 4:00: 2012 4:01.98 2013 4:00.72 2014 4:00.01 2015 4:00.83 2016 4:01.11 2017 4:00.60 2018 3:59.24 2022 3:57.76 pre-superspike 2012-2018 average: 4:00.64. But the standard deviation is crap at 0.86 second and not usable for the way I'm doing comparisons - so skip this.
3:43.69 1500m is 4:00 mile pace, and pace is what matters to the shoe, so trying the 401st 1500m performer: 2010 3:43.70 2011 3:43.57 2012 3:42.94 2013 3:43.47 2014 3:43.45 2015 3:43.36 2016 3:43.39 2017 3:43.58 2018 3:43.69 2022 3:41.28 pre-superspikes: mean 3:43.46, standard deviation 0.23 second. That's 2.18 second difference at 1500. At the mile, 2.18/1500*1609.344=2.4 second. This aligns close to my table above (0.1 second off). But considering what I'm comparing (mean of 7 numbers to 1 number), I still prefer to round to 2 seconds.
it if you compare the 10th & 15th best performer each year there is no change in the last 20 years.
Someone good at computers could scrape the entire World Athletics database and add thousands of comparisons. I only have four points, one point for 1000th performer comparison in each of 800, 1500, 5000, and 10000 in the figure below. For each rank from #1 performer of each year on down until you run out of ranks to compare, subtract the 2022 time for the rank from the 2012-2018 mean for the ranks. That's the benefit for that particular comparison. Then calculate the pace per 400 of that 2012-2018 mean. Put the point (x=400 pace, y=log10 of benefit) on the graph below. Do that for the 800, 1500, 5000, and 10000 events, and put them on the same graph. That will add 3800+ points from the 800, down to 1400+ points from the 10000. You'll end up with a scatterplot with around 10,000 points. Add the best fit line. I bet it would be close to the line drawn through the four points already on the graph because the comparisons I used had low standard deviation. Use that line to refine my oldspikes/superspikes/benefit by 400 pace table. The high rank comparisons (1st, 2nd... 10th & 15th like you want, etc.) would fall farther from the line on average, providing the "scatter" in the scatterplot, but would not detract from the result.
That's roughly what Nick Willis estimated based on his feel for the super spikes (he said ~1 second per lap), so it sounds plausible. Nice to see they're doing work on this anyway
You know what I never see in these analysis? Every sport has better athletes year over year, not allowed in distance running. Never allowed for..everyone is a drug cheat or has better shoes.
There are over 100M more Americans alone now than 1975.
Coaching is way better, way better years over years.
instant info thru Internet, guys/gals know what the marks are..how many run them, it gives folks a glimpse so much more quickly as to what is possible. You used to have to wait a month back in the day.
Pacing. most of it solid in almost every single race. I think this IS the biggest factor. Not that they never existed, but the sheer volume of them.If you are an Elite... elite HS kid, you can find at least 3 shots in multiple distances for set up races, without even disrupting your season.
If they made that much difference why isn't Ingebrightsen running..3:26 regularly by now. He rarely loses and has beaten everybody in multiple events at some point or other.
I read this piece yesterday, and found much of it soundly valid, but I never see the other factors even mentioned.
I think the shoes help..3.2 seconds at a mile.?.no way no how. I will never be convinced of that..doesn't mean I am not wrong LOL.
The 1500m was the most doped up event. Kiprop, Maflhouki, Lagat, etc. Kenyans have gotten ANNIHILATED by drug testing.
11 of the top 50 total 1500m times in world history are from the past 3 years. Out of the 39 remaining times, at least 30 of them are DIRTY.