Mile by Mile Analysis Of How The Hills Will Impact The 2020 US Olympic Marathon Trials

By Robert Johnson
February 26, 2020
One of the most-discussed aspects of Saturday’s 2020 US Olympic Marathon Trials in Atlanta is the course. It’s hilly. Very hilly.
Tell us when you last saw a major marathon that featured a course topography like this:
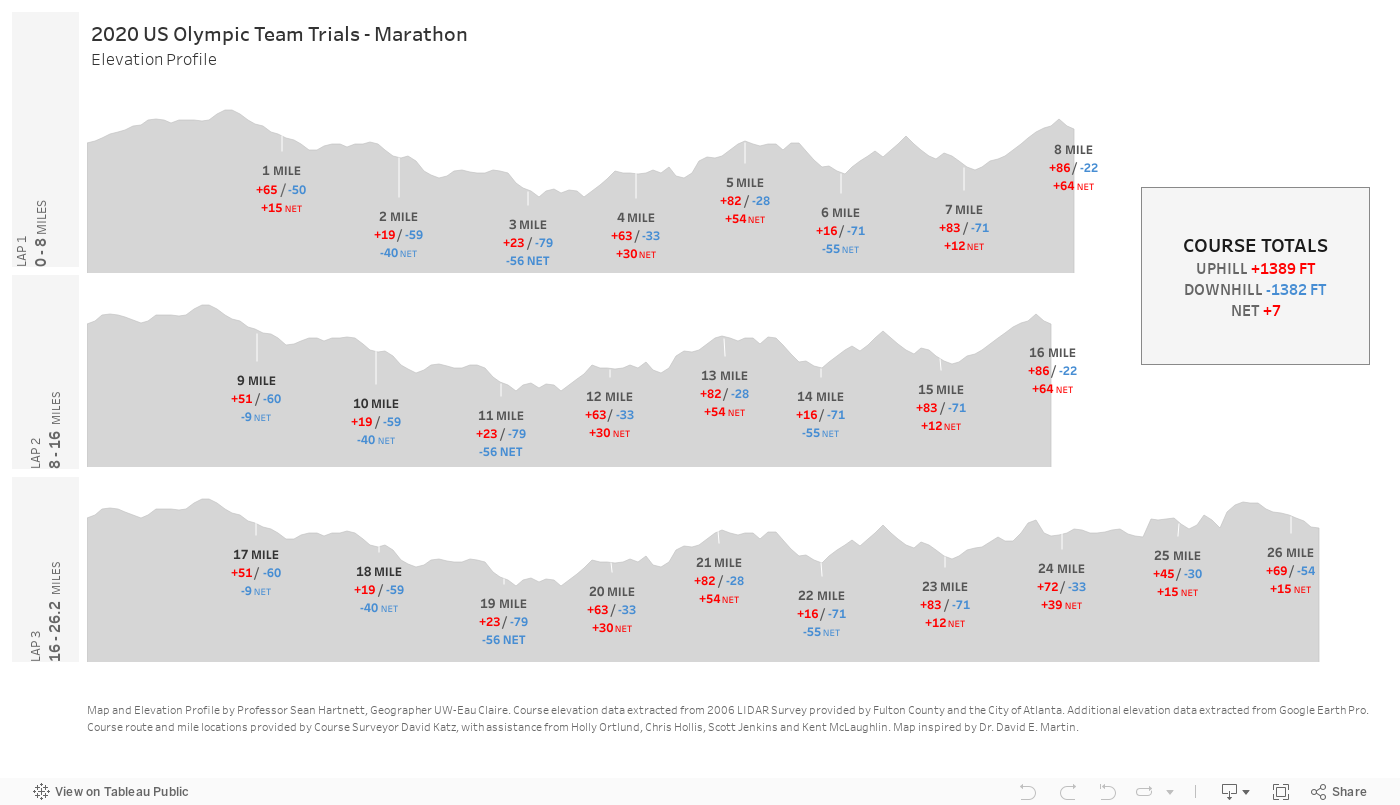
Full PDF chart here.
So how much will that slow the runners down?

Well we reached out to LetsRun.com coaching/stat guru John Kellogg for his analysis. We don’t want to be watching the race and hear the commentators make some uninformed comment of, “Runner X just slowed down 15 seconds that mile — they are really in trouble” when in reality they didn’t slow down at all in terms of effort – the course just got a lot more difficult. Remember, John is the guy who basically anticipated the 2:03:02 in Boston in 2011 based on the wind as well as Yuki Kawauchi‘s 2:15 winning time at Boston in 2018.
In general, Kellogg says that a 10-foot elevation drop in a race helps you by 1.8 seconds and a 10-foot elevation gain hurts you by 2.4 seconds. So we had him go mile-by-mile to see which miles would be faster than normal and which would be slower than normal due the hills. For an elite male, here is how each mile compares to a perfectly flat course, per John Kellogg:
Please understand that the mile-per-mile elevation changes alone, not counting the cumulative effects of hills in 2+ hours of running (including all the quad busting from 1,382 feet of downhill running) shapes up like this at 2:10 to 2:12 pace on a flat course, ceteris paribus:
Mile 1 + 6.1 secs.
Mile 2 – 5.8 secs.
Mile 3 – 8.8 secs.
Mile 4 + 9.0 secs.
Mile 5 + 12.4 secs.
Mile 6 – 8.5 secs.
Mile 7 + 7.1 secs.
Mile 8 + 15.9 secs.
Mile 9 + 6.1 secs.
Mile 10 – 5.8 secs.
Mile 11 – 8.8 secs.
Mile 12 + 9.0 secs.
Mile 13 + 12.4 secs.
Mile 14 – 8.5 secs.
Mile 15 + 7.1 secs.
Mile 16 + 15.9 secs.
Mile 17 + 6.1 secs.
Mile 18 – 5.8 secs.
Mile 19 – 8.8 secs.
Mile 20 + 9.0 secs.
Mile 21 + 12.4 secs.
Mile 22 – 8.5 secs.
Mile 23 + 7.1 secs.
Mile 24 + 11.2 secs.
Mile 25 + 5.3 secs.
Mile 26 + 6.3 secs.
To Finish – 4.0 secs.
Coaches, race fans, TV commentators, and Trials participants, please do yourself a favor and print out the chart above and carry it with you in your pocket on Saturday. If the pace between mile 5 and mile 6 or 13 and 14 or 21 and 22 varies by more than 20 seconds, don’t freak out. To be honest, that’s expected. And TV commentators, if you use this, please give a little love to LetsRun.com and John Kellogg — “John Kellogg, LetsRun.com’s statistics expert — a lifelong coach with a masters degree in mathematics.”
So what do all of those pluses and minuses mean overall? Kellogg says the hills, taken individually and accounting for both uphills and downhills, will slow the runners by roughly 90 seconds. Add in another minute or so for the cumulative impact of the hills and maybe 30 seconds for all of the turns and you are looking at a course that could run up to three minutes slower than a pancake-flat course with few turns. Kellogg writes:
The total slowdown over the course using these figures alone would be 1:24.6 for the top men. For the elite females running @ 11% slower, the slowdown would be 1:33.1. Remember that this doesn’t account for a cumulative slowdown from the constant ups and downs. This is nearly impossible to predict accurately, partly because lighter runners may do better on hilly courses, particularly if there is a lot of downhill. But it’s probable that all that quad busting could slow the times down by an additional minute (give or take) more than those 1:24.6 / 1:33.1 figures. Boston is normally slower for most people than flat courses are (unless there’s a big tailwind at Boston), and it has a significant net downhill.
There also appear to be 35 (if I counted right – whatever, it’s a lot) significant turns. This will disrupt the rhythm and create enough additional cumulative fatigue to slow things down even more. As a ballpark figure, I’m guessing this course could be 3-ish minutes slower for the top runners having good days than an ideal course with fewer than 5 hard turns and less than +/- 10 feet per mile elevation change (this course has +/- 53 feet per mile elevation difference). Assuming good weather and people willing to set an honest pace, anything under 2:12 for the dudes and under 2:25 for the chicks would be impressive on this puppy given the PRs of the entrants.
Talk about this article and John’s brilliance on our messageboard: MB: Here is his mile by mile analysis of how much the hills will impact the 2020 US Olympic Marathon Trials