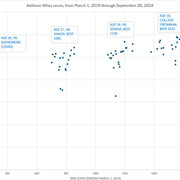
To explain how I did these graphs I will use Wiley as an example since I kept the statistics. Unfortunately, I did not save the specific stats for the others.
Anyway, for Wiley, I have a database of just about every race she has ever run, gathered from Milesplit, Athletic.net, Athlinks, WA, etc. In total, there are 207 races, including cross country, indoor, outdoor, road races, and even relays.
First, I eliminated all cross country and road races since they are varying (and uncertified) distances and terrains and are consequently useless to compare to one another.
Next, I eliminated all relays (even if I knew the split) because they are not true races – a 400m during a 4x400m is not the same as an open 400m.
Finally, Wiley is well known for competing in several races a day. For example, at the state meet her senior year, she ran the 1600m, 800m, and then only 25 minutes later the 3200m. There is no way that the 3200m could be an accurate assessment of her ability that day. To alleviate this problem, I used the best score of any meet where multiple events were run. I feel this best displays the athlete’s performance ability that particular day.
All told, this eliminated 33 relays, 34 cross country races, 10 road races, and 36 races that were multiple races, leaving the total at 94.
Finally, since there are no WA scoring tables for 1600m and 3200m, I used the Mileplit converter () to convert to mile and 2-mile.
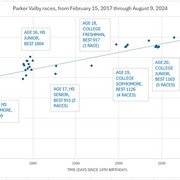
All 94 races are plotted, regardless if they are finals, prelims, or races used as training runs. All distances are included – in Wiley’s case, this even included 200m races which for obvious reasons were not highly scoring.
On the track, she ran: 4x200m, 7x400m, 4x600m, 43x800m, 3x1000m, 20x1500m, 19x1600m, 11xmile, 3x3000m, 15x3200m, and 1x5000m.
Once the multiple race days were eliminated, those plotted include: 1x200m, 6x400m, 4x600m, 32x800m, 1x1000m, 19x1500m, 10x1600m, 9xmile, 1x3000m, 10x3200m, and 1x5000m.
The same process was used for Valby’s and Tuohy’s graphs.
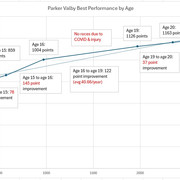
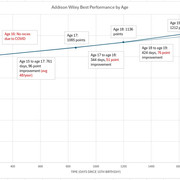
In Wiley's Best by Age graph, the only place where it was slightly off perfect was at age 19. This was also the first time she had ever competed in a race later than early July. So, I decided to redo the graph using her best performance at each age as of July 4 to keep it consistent. When I did, it put her entire career from her HS freshman year to present directly on the regression line. As close to a perfect linear progression as I have ever seen.