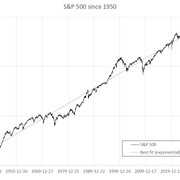
Let me try to illustrate some points I've made over the past few days. I'll start by showing S&P 500 since 1950, along with an exponential best fit:

It's hard to make a lot of sense of things with the index plotted at a natural (linear) vertical scale, so here is the same curve with the y-axis a logarithmic scale:
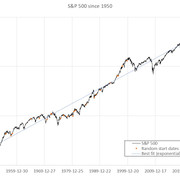
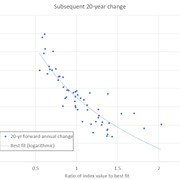
You can see that when viewed in this way, there is a consistent long-term trend, with considerable fluctuation above and below the best fit line. I've also shown 25 points along the curve as start points for 25 years of subsequent index performance. If you started with $1 million invested in SP500 at each of those points, you would see 25 different 25-year trends as follows:
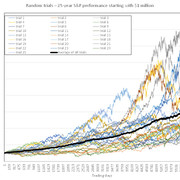
Depending on the date your time machine took you back to, after 25 years you might have over $15 million (great!), or you could have about $3 million (not great). The average (or "expected") result is a little over $6 million, with an average annualized return of just under 8%. That, even though the average annual change of the index since 1950 is 9.3%.