Zero cadence CANNOT be caused by poles. Maybe for a second or two, but not for four nines. This has even been proved by Streetferret with his videos. STOP saying things confidently that are not true. You're like Trump!!!
This thread was originally titled, "Incredible development in the $612,000 Transcon Goodge run, currently ongoing" but the new title is more descriptive. The description of the run is here.
-
190
-
Washed88 wrote:
From what I understand, the Strava data is smoothed and simplified.
The 1 second interval downloaded Strava data being used in the graphs of this thread are not smoothed and simplified by Strava. The graphs you see on the Strava app or web page ARE enormously smoothed and simplified to the point of cutting out important data. Big difference. The data we downloaded in this thread is valid. The Strava graphs themselves are not.
018 -
Miles, not nines
*ragepost*
All I can hope that comes good of this is that Sneakers has has quality time wasted. For me, it's just the dying embers of my work day. Sorry, boss.
150 -
Sneakers On The Ground 2.1 wrote:
DataLoves1 wrote:
Honestly I have barely looked at the table but my initial take was that IF he was riding in the van (assuming that is what we are attributing the zero cadence to) then they are going significantly slower than his running pace when he has around ~180 cadence.
That is the "micro riding" that PJ's accusers have now put forth as their main accusation of how PJ is cheating after I showed there are no enormous speed increases they previously accused him of.
Of course when he hops in the van, they should step on the gas! Not continue at the speed they were already doing right behind him.
You are obviously smarter than that, I think this strawmanning proves your bad faith. Not saying he was or wasn't van riding, just saying that's a cheap trick on your part and a poor argument.
120 -
Sneakers doesn't do good arguments.
Gets pulled over by a traffic cop
"Can I see your licence, sir? You were doing 85 in a 70"
"Yes, but if you smooth my average I was doing 69" (nice)
"When you went past me you were doing 85"
"Have you applied a Kalman filter to that"
"No sir, just radar."
"You need to apply a Kalman filter"
"Show me your licence, sir"
"You need to apply a Kalman filter"
"Licence. Now."
"Shi*ty misapplied graph? That ok?"
"Can you get in the back of the patrol car, sir?"
260 -
theweatherman wrote:
Zero cadence CANNOT be caused by poles. Maybe for a second or two, but not for four nines. This has even been proved by Streetferret with his videos. STOP saying things confidently that are not true. You're like Trump!!!
Ok so I just looked at this. The largest distance in the data without recording a single >0 cadence value was 0.19 miles between 31.52 and 31.71
Although there are some periods with cadence points few and far between. Miles 30-35 for example have 4103 data points (4103 seconds, 68 mins) but only 1530 of them have a recorded cadence.
90 -
Sounds...sketchy.
Home time for me. Over to the rest of you. Thank you for your interjection, whatever the result ends up being, DataLoves1.
120 -
DataLoves1 wrote:
Ok so I just looked at this. The largest distance in the data without recording a single >0 cadence value was 0.19 miles between 31.52 and 31.71
Although there are some periods with cadence points few and far between. Miles 30-35 for example have 4103 data points (4103 seconds, 68 mins) but only 1530 of them have a recorded cadence.
You need to filter out the data points where PJ is resting with close to zero speed and a cadence of zero would be expected. If you plot a histogram of the cadence, you can clearly see what his walking speed and running speeds are, two distinct humps. PJ often alternates between running and walking with rest periods.
24 -
Sneakers On The Ground 2.1 wrote:
You need to filter out the data points where PJ is resting with close to zero speed and a cadence of zero would be expected. If you plot a histogram of the cadence, you can clearly see what his walking speed and running speeds are, two distinct humps. PJ often alternates between running and walking with rest periods.
Meant to write that you should plot a histogram of the speed to see the two distinct humps for walking speed and running speed, not histogram of the cadence like I wrote above
13 -
Sneakers On The Ground 2.1 wrote:
DataLoves1 wrote:
Ok so I just looked at this. The largest distance in the data without recording a single >0 cadence value was 0.19 miles between 31.52 and 31.71
Although there are some periods with cadence points few and far between. Miles 30-35 for example have 4103 data points (4103 seconds, 68 mins) but only 1530 of them have a recorded cadence.
You need to filter out the data points where PJ is resting with close to zero speed and a cadence of zero would be expected. If you plot a histogram of the cadence, you can clearly see what his walking speed and running speeds are, two distinct humps. PJ often alternates between running and walking with rest periods.
I know. There are no periods between miles 30-35 where he was stopped or resting.
150 -
theweatherman wrote:
Zero cadence CANNOT be caused by poles. Maybe for a second or two, but not for four nines. This has even been proved by Streetferret with his videos. STOP saying things confidently that are not true. You're like Trump!!!
What's funny is that his endless references to metadata are completely redundant if the "trekking pole argument" is actually valid (and it's a non-starter unless it's an observable pattern across all PJ's data in which the use of trekking poles is known or highly likely.).
"Trekking poles" are to this transcon what "tech failures" were to WG's. Why bother parsing second-by-second metadata from Strava only to turn around and attribute all cadence anomalies to the use of trekking poles?120 -
theweatherman wrote:
Sneakers doesn't do good arguments.
Gets pulled over by a traffic cop
"Can I see your licence, sir? You were doing 85 in a 70"
"Yes, but if you smooth my average I was doing 69" (nice)
"When you went past me you were doing 85"
"Have you applied a Kalman filter to that"
"No sir, just radar."
"You need to apply a Kalman filter"
"Show me your licence, sir"
"You need to apply a Kalman filter"
"Licence. Now."
"Shi*ty misapplied graph? That ok?"
"Can you get in the back of the patrol car, sir?"
you forgot the part where he says "you don't know how to download the data even though i already told you"
130 -
DataLoves1 wrote:
Sneakers On The Ground 2.1 wrote:
You need to filter out the data points where PJ is resting with close to zero speed and a cadence of zero would be expected. If you plot a histogram of the cadence, you can clearly see what his walking speed and running speeds are, two distinct humps. PJ often alternates between running and walking with rest periods.
I know. There are no periods between miles 30-35 where he was stopped or resting.
Actually, there are at least 4 distinct periods between miles 30-35 where both the speed and cadence values show that PJ is resting/stopped. Just did this crude graph of the speed at miles 30-35 with a bit of smoothing (I used the time since run start on the horizontal axis instead). You can clearly see the cadence drop to zero when the speed also drops below 1 mph. The speed values will change a bit if I did proper noise filtering instead of just a bit of smoothing but I think you get the picture:
29 -
Sneakers On The Ground 2.1 wrote:
DataLoves1 wrote:
I know. There are no periods between miles 30-35 where he was stopped or resting.
Actually, there are at least 4 distinct periods between miles 30-35 where both the speed and cadence values show that PJ is resting/stopped. Just did this crude graph of the speed at miles 30-35 with a bit of smoothing (I used the time since run start on the horizontal axis instead). You can clearly see the cadence drop to zero when the speed also drops below 1 mph. The speed values will change a bit if I did proper noise filtering instead of just a bit of smoothing but I think you get the picture:
This is not miles 30-35, it is later in the activity. I am worried about your proficiency in all of this.
140 -
frothrippah wrote:
This is not miles 30-35, it is later in the activity. I am worried about your proficiency in all of this.
Whoops, you are right. Plotted the wrong set of data
112 -
Sneakers On The Ground 2.1 wrote:
DataLoves1 wrote:
I know. There are no periods between miles 30-35 where he was stopped or resting.
Actually, there are at least 4 distinct periods between miles 30-35 where both the speed and cadence values show that PJ is resting/stopped. Just did this crude graph of the speed at miles 30-35 with a bit of smoothing (I used the time since run start on the horizontal axis instead). You can clearly see the cadence drop to zero when the speed also drops below 1 mph. The speed values will change a bit if I did proper noise filtering instead of just a bit of smoothing but I think you get the picture:
I think I am over responding to you, you have been toxic since I came here and I assume you are trolling. That is not the right data, stop wasting my time.
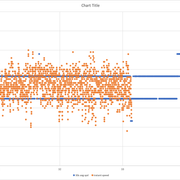
This is what I see from miles 30-35. 30s avg speed is based on distance travelled over 30s prior, not anything to do with instantaneous gps speed. You can see the instant speed drops out during this period which I did not notice until now. For 1486 of the 4103 data points there is no instant speed.
150 -
DataLoves1 wrote:
I will stop triple posting I promise. What I want to know is:
1. Does this view make sense to everyone? Is it helpful?
2. Do we need to bring in any other data elements?
3. Do we want to repeat this view for any other dates?
This is the data view:Like I've said several times, this is literally not data analysis and I'd expect an intern to be able to do this on their first day. But that's not really the point, I just want to get to the bottom of this.
Also, could someone clarify what data is available in the original Garmin files that is not in the Strava data? Or is it more that the Strava data has been through some form of manipulation by Strava itself?
DataLoves,
Thanks for doing this. Yes, it is a much more digestible overview than what we can see on Strava. Would you be so kind as to make a similar table for March 8? This day had long periods with no cadence on the Strava graphs. Paul also uploaded the data from both his watches (1 has since been deleted) that had matching zero cadence periods, which may cast some doubt on the trekking poles theory. Doesn't prove anything, of course, but would be interesting to see.
130 -
During this run there is a period of 0.19 miles without recording a cadence value.
There is also a period of 0.67 miles in 8m 45s while climbing 57 metres while only recording two cadence values total: 32 and 34
Heart rate remains high during both.
Make of this what you will, I ain't implying anything just sharing the actual data.
120 -
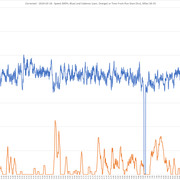
Here is the corrected speed and cadence graph for miles 30-35:
There is one period around 7.94 hours into the run where the speed drops to zero and the cadence is also zero indicating that should be a brief rest.
Also seen is that when the speed is above about 5.5 mph the cadence rises up to expected levels. But when below that, the cadence varies without a distinct pattern between 0 to about 30 rpm (multiply by 2 for spm). Is this indication of riding in the van/RV? That is not conclusive from this graph. I'll have to pull up the unsmoothed graph.
18 -
DataLoves1 wrote:
I think I am over responding to you, you have been toxic since I came here and I assume you are trolling. That is not the right data, stop wasting my time.
This is what I see from miles 30-35. 30s avg speed is based on distance travelled over 30s prior, not anything to do with instantaneous gps speed. You can see the instant speed drops out during this period which I did not notice until now. For 1486 of the 4103 data points there is no instant speed.
I think I will let you take over this thread. I wrote before your post above that I plotted the wrong data by mistake. Clearly you think you know more than anyone and didn't spot the rest period in the corrected version of my miles 30-35 plot
017

What People Are Talking About On LetsRun
No top threads at the moment. Check back soon.