ok if you wish to go with what people 'feel' about their finances and not actual data, then we can't really have a discussion. Yes, people 'feel' bad. People ALWAYS 'feel' bad about their lives. It's how we are. We always think the country is on the wrong path and we always feel our kids won't have the same fortunes we have. But then....they do.
Picking a peak and then using that as a baseline is unfair and a chart crime.
I'll say again - incomes of all levels have gone up rather smartly. There is no denying this. You seem to wish to deny 2015-2025 happened, for some reason. Weird.
You are welcome to have the last word. I'm out!
What a copout.
If you really wanted to discuss, you could find figures properly adjusted for inflation, instead of feelings, because the inflation was real, as your link to the WSJ said "inflation took a bite".
Initially you said for the last few decades and now you are hanging your hat on the last 10 years.
Not sure what "smartly" is supposed to mean, unless it means a little bit.
When you look at your curve, I could have gone back to the beginning of your chart to 1979, and make the same points through 2014 -- 35 years with no wage gain for the median income. This can only be described as stagnation, despite the dramatic increase in wealth and productivity.
We are all aligned that wage progress was made in the last 10 years.
The reasons for all of this are detailed and worthy of discussion. For example at and below the median, men and hispanics are worse off, and women are much better off, but college graduates are earning less, and non-income benefits, like health coverage, is dropping across the board, adding the expense of private insurance. And how do other factors, like student loan debt, and rising house prices factor in?
look, internet chat doesn't work here unless we look at one point at a time.
You say median hispanics are 'worse off. '
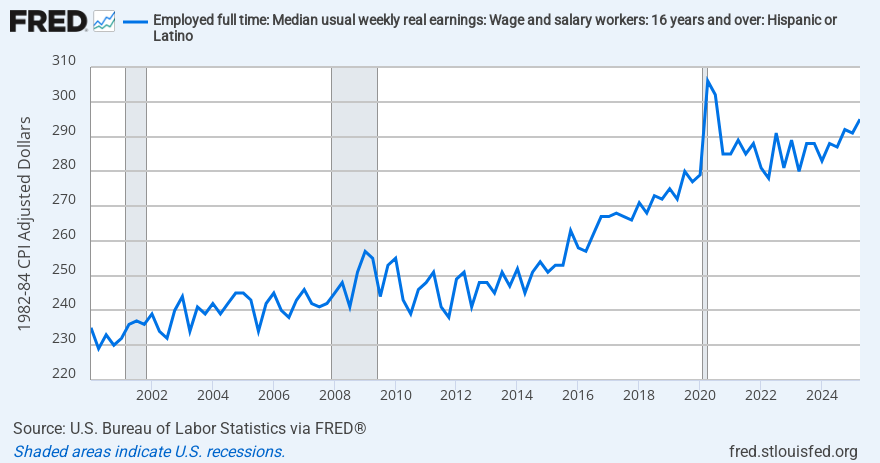
But then I can show you data that show hispanic REAL AFTER INFLATION wages are up 26% this century.
Do you choose to engage on that one point? I don't want to read a post with 10 points that I have to pick and choose from. And why do you think with wages up that strongly that hispanics are 'worse off?'
Which of your links said "a red state, dropped out of HS, never went to college, work sporadically and use drugs, your income has suffered from the loss of factory jobs"?
Do you even read any of these links, beyond the headlines?
The links you showed me showed median income going up a little over decades. The 1986 peak under Reagan was equaled in 2006, 2008, 2013, and 2014, nearly 30 years later -- for the median income.
Your WSJ article that says: "The years from the early 1980s through much of the 2000s were characterized by widening wage inequality." Did that come in your search for "myth of inequality"?
It says something changed around 2015 "a change that economists believe was driven, in part, by a sharp drop in the unemployment rate".
These large jumps around 2020 and 2021 were unique to the pandemic, as companies who had laid off workers during shutdowns were desparate to rehire. It was a temporary glitch that is now self-correcting.
Your WSJ article adds "Not all low-wage workers benefited. Wage growth among older people, who were less likely to switch jobs, wasn’t as strong. Inflation, of course, took a bite."
Which brings up inflation -- despite the numbers, voters didn't feel better off with the higher wages because it wasn't going any further for them. The WSJ chart doesn't look like it is adjusted for the inflation everyone was complaining about.
It's also hard to see in any of your charts of wages of income earners, if or how the unemployed are represented -- both those looking for work, and those who gave up.
But what there is no denying is the amount of wealth accumulated by the top 1% compared to the bottom 90%, since Reagan.
ok if you wish to go with what people 'feel' about their finances and not actual data, then we can't really have a discussion. Yes, people 'feel' bad. People ALWAYS 'feel' bad about their lives. It's how we are. We always think the country is on the wrong path and we always feel our kids won't have the same fortunes we have. But then....they do.
Picking a peak and then using that as a baseline is unfair and a chart crime.
I'll say again - incomes of all levels have gone up rather smartly. There is no denying this. You seem to wish to deny 2015-2025 happened, for some reason. Weird.
You are welcome to have the last word. I'm out!
Americans always feel bad, for sure. That’s capitalism for you.
Economics is a social science bc behavior or how people feel about what’s going on is part of it. You can’t discard the psychology of money.
Also, is inflation part of these numbers? Greater incomes don’t matter if everything else went up too.
if I cite a data point described by the word 'real' then yes, that means inflation is taken into consideration.
look, internet chat doesn't work here unless we look at one point at a time.
You say median hispanics are 'worse off. '
But then I can show you data that show hispanic REAL AFTER INFLATION wages are up 26% this century.
Do you choose to engage on that one point? I don't want to read a post with 10 points that I have to pick and choose from. And why do you think with wages up that strongly that hispanics are 'worse off?'
I didn't specifically want to talk about hispanics, but sure, it can serve as an example. I didn't say hispanics were worse off, "congress.gov" did.
I gave you charts from "congress.gov" while you gave me charts from the Federal Bank of St. Louis, sourcing the US Bureau of Labor Statistics. I have no reason to think either are lying, so what can explain the difference between -2.2% and +26%? Are we comparing apples to apples?
Remarkably, they are both ultimately based on the same "CPS" data, and both seem to be CPI adjusted, although the "congress.gov" says CPI-U.
One difference is that my charts range from 1979 to 2019, while yours ranges from 2000-2025. If we cut yours off at 2019, the wage growth is 17.8%. Does that mean that median hispanic wages dropped by 20% between 1979-1999? That is consistent with your first chart showing a significant drop from 1979-1981, and remaining flat until the late '90s. Maybe that lasted longer for Hispanics. It looks like all the wage gains from 2000-2019 were significant, but maybe just significant enough to bring them almost back up to 1979 wages. If I found a more recent report, perhaps the hispanics would have finally seen positive gains including the last 6 years. But recall, I was talking about the growth and productivity since the Reagan-era in the '80s, and how that didn't trickle down.
Another difference is yours is labelled "Full-time employment", while mine says "employed (full- and part-time)". Are the part time wages making a significant difference? Is there a significant shift from higher paid full-time to lower paid part time work?
It's concerning that both sources seem to be presenting CPI adjusted data from the same source, but you find a report showing +26% while I find -2.2%.
Another point that "congress.gov" makes is that wages are about 70% of the story: "While wages are typically the primary component of compensation—accounting for about 70% of compensation for the average worker—non-wage compensation, such as employer-provided health insurance, paid leave, and retirement contributions, plays a role in living standards as well. Workers may experience gains or losses in wages but overall compensation may not track these changes exactly because of the cost of non-wage compensation."
This post was edited 8 minutes after it was posted.
Interesting information on the most promiscuous countries, showcased by The Global Promiscuity Index (GPI), analyzing the promiscuity by six indicators.