Sirpoc's real name, although hardly a secret, should not be made public.
Legend has it that if you ever say sirpoc's real name out loud, the NSA spell is broken and this training will make you slower and give you shin splints instead.
I'm still working through this phenomenal thread. However, I have a math and computer science degree and enjoy digging deep into the analytics of my running data, which includes different ways to score a run. It's unfortunate this spreadsheet was deleted as a result. Any way to resurrect it, or does it surface up later in the thread in a different form?
Reddit dumped me here. Reddit is my jam, but this thread is solid. I'm only about 40 pages in, and I keep going back to previous pages when things are quoted and replied so, so I'll be here a long, long while. Haha.
Thanks for sharing your spreadsheet. I'd be curious to see it converted to critical power instead of VDOT, which shouldn't be too challenging. I'll make (another) copy and see what I can hack up. With Stryd's CP, if valid, we have a good idea of where our lactate responses are without needing a lactate meter. So following all this advice, but using Stryd's food pod instead of a lactate meter should be very doable.
However, what I'm interested in specifically at this point in my reading is learning the training load score that Tinman used with his V̇O₂ max workouts. I emailed him and he said he never released it, so I'm curious if it got reverse engineered by Hard2Find and what they came up with.
Scoring runs (TSS, RSS, TRIMP) ends up with unit-less values and they're only of interest to the individual athlete. Having say a CTL of 60 shouldn't mean anything to you or anyone else, but it's of value to me tracking over time.
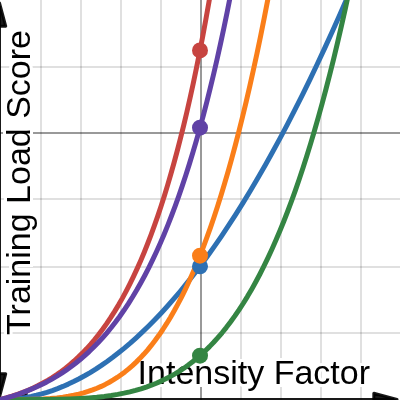
So I'm curious to see how Tinman's scoring system would compare to the others. I made a Desmos plot to see what the shape of the curves looks like. It assumes 1 hour of exercise. The x-axis is the intensity factor (EG, % of FTP) and the y-axis is the score. Points are plotted where the intensity factor is 100%.
Be aware that there are differences between the sub-T pace ranges given in this worksheet and those given on the Lactrace site. There's also not-so-subtle differences in the calculated 65% MAS pace used for easy days.
1. CTL is an exponentially weighted moving average of TSS. The latter is calculated based on an individual's FTP. Thus, from a theoretical perspective, a CTL of, e.g., 60 does indeed mean the same thing to everyone.
2. Your graph incorrectly illustrates the relationship between HR-based training load metrics (e.g., TRIMP). Since HR can't exceed maximal HR, all such scores plateau at ~100% of VO2max (IF = ~1.2). IOW, they provide no extra "credit" for supra maximal intensity exercise. For distance runners that may rarely explore such realms, this really isn't a problem, but for, e.g., cyclists, it definitely can be.
1. CTL is an exponentially weighted moving average of TSS. The latter is calculated based on an individual's FTP. Thus, from a theoretical perspective, a CTL of, e.g., 60 does indeed mean the same thing to everyone.
CTL of 60 is not the same across athletes. Case in point, if athlete "A" executes an easy run at 80% FTP seven days per week, then they would need to run for 56:15 to get a TSS score of 60. Over time, their CTL will approach 60 as an asymptote.
However, if athlete "B" runs three HMP tempos per week of 10' WU, 20' @ 98% FTP, 5' CD, this has a TSS 58.68, almost 60. If the other four runs are the previous easy runs of 56:15 @ 80% FTP, this athlete's CTL will also approach 60.
I would argue that the CTL in athlete "B" describes a different fitness than athlete "A", even though they have the same numerical value.
Andrew Coggan wrote:
2. Your graph incorrectly illustrates the relationship between HR-based training load metrics (e.g., TRIMP). Since HR can't exceed maximal HR, all such scores plateau at ~100% of VO2max (IF = ~1.2). IOW, they provide no extra "credit" for supra maximal intensity exercise. For distance runners that may rarely explore such realms, this really isn't a problem, but for, e.g., cyclists, it definitely can be.
Indeed. It's not true apples-to-apples. HR is not as responsive as power, so for high intensity short duration reps, it's not a great reflection of effort like power or pace. And because TRIMP defines intensity as (AvgHR-RHR)/(MaxHR-RHR), it is impossible to get an intensity factor greater than 100% as you mentioned, unless the athlete incorrectly set their max HR or their HRM is faulty.
The plot isn't to say one is better than the other, but merely show how scores compare numerically at different intensities of 1 hour. I would also like to investigate whether or not one scoring system biases stress over volume or vice versa (this plot doesn't do a good job identifying these biases).
So no, it's not apples-to-apples, but it prompts discussions about scoring exercise stress. Initially, this just started as "TSS vs RSS @ 1 hour", but eventually Daniels got added, then TRIMP. I've debated adding others:
- Session-RPE - Strava's Relative Effort - Excess Post-exercise Oxygen Consumption (EPOC) - Power Profile Index (PPI, from Courel-Ibanez, 2002)
Strava's RE is discrete rather than continuous based on HR zones, as is PPI being discrete based on power zones. So those might be interesting to put in a separate plot. Maybe TRIMP and EPOC should go in their own plot as well, given the metabolic nature of the scoring.
Anyway, this is just a way to investigate the different scoring systems and I'm definitely open to ideas for improvement. Such as plotting time vs IF rather than IF vs score.
CTL is not a description of fitness. How one achieves a given CTL is therefore irrelevant to the fact that it is, as I said, theoretically directly comparable across individuals.
That different training load metrics weight intensity differently was the point of the penultimate slide of this presentation:
I would also like to investigate whether or not one scoring system biases stress over volume or vice versa (this plot doesn't do a good job identifying these biases).
To do this normalize the curves to each intersect at (0,0) and (1, 100). So Daniel's formula would become 100*x^4, while male TRIMP would have the multiplier changed from 38.4 to about 15 (38.4/2.5).
From this you can see that TSS gives relatively the highest value to volume, Daniel's values intensity the highest, while TRIMP and RSS are more in the middle (TRIMP being closer to TSS)
I would also like to investigate whether or not one scoring system biases stress over volume or vice versa (this plot doesn't do a good job identifying these biases).
Looking at Andy's slides, your TRIMP formula may be inaccurate. Based on his penultimate slide, TRIMP gives the most relative value/credit to low intensity work, compared to other measures of load.
Just to drop in as a few side notes. Hopefully nobody is using CTL to compare to other people. It's totally individual and the only time I have found any use for it, be that running or cycling, is an individual basis. The number really doesn't mean anything outside of the individual athletes physiological makeup.
The second thing is probably this. Because I am training (or anyone else who's seen the same success doing this) virtually the same, all the time, then CTL is really just being used as a guide for seeing if more is more, until it's not. It consistency is showing the relationship to me being fitter. Because there is no specificity, it doesn't really deal with intensities it might struggle with. Even the easy runs probably get over credited as I've said before. But, who cares? I've basically trained around the same intensity on my easy runs and all my sub workouts. So I'm just using it as a guide for what night be sensible to do next or more of, or just a reflection of my own training.
Anyway I'm not sure that's adding a whole bunch. I just wanted to be clear of why (it's useful to me) and what I wouldn't be using it for, in the spirit of the thread and trying to keep things practical.
Looking at Andy's slides, your TRIMP formula may be inaccurate. Based on his penultimate slide, TRIMP gives the most relative value/credit to low intensity work, compared to other measures of load.
A systems model is proposed to relate a profile of athletic performance to a profile of training. The general model assumes that performance has four components: endurance, strength, skill, and psychological factors. Each of...
Actually, I have a question for you while I've got your attention. Did you consult Stryd on their RSS formula? IE, RSS/second = 3/100 * (P/CP)^3.5? Somewhere (I think their own forum, but might be elsewhere) someone asked how the formula was created, and their response was it came from an exercise physiologist. Just curious if that was you.
Also I have a signed copy of the third edition of your book Training & Racing with a Power Meter. Even though I'm a runner, I train by power and there is a lot of good nuggets in there that are applicable to running. It's a great read.
It's just post-run data analysis after you've done the workouts. I'm not suggesting the training structure as presented by sirpoc84 gets changed in any way.
Hopefully nobody is using CTL to compare to other people. It's totally individual
Again, no. As I have pointed out several times now, because TSS is calculated using FTP, it takes into consideration differences in muscular metabolic fitness, and is thus theoretically completely comparable between individuals.
Of course, although in theory there is no difference between theory and reality, in reality there is. Nonetheless, the fact remains that the paradigm works well across a broad range of athletes, with a CTL* of 100-150 being "optimal" (really, max tolerable) all the way from masters cyclists to Grand Tour winners. Those maintaining a CTL of less than 100 are typically time-constrained, and generally recognize that they could train more without breaking down, whereas I have yet to see anyone exceed 150 for a prolonged period of time.
*Based on TSS, which is a cycling-specific metric.
I may be wrong, but I think Sirpoc means that your expected fitness/race pace/improvement per changes in CTL is what is different person to person. But again, doesn’t really matter.
@Coggan, out of curiosity if you had to apply this to running, how would you change it? Do you simply mean runners “range” would be lower? Or would you calculate TSS differently? (ie not just rTSS or whatever)