Top five stocks 17.34% of the index. Distortion is even greater when you add up the market cap of the top dozen. Over 400 have weightings under 0.25%. Market cap of Apple and Microsoft higher than the entire German stock market.
Top five stocks 17.34% of the index. Distortion is even greater when you add up the market cap of the top dozen. Over 400 have weightings under 0.25%. Market cap of Apple and Microsoft higher than the entire German stock market.
seattle prattle wrote:
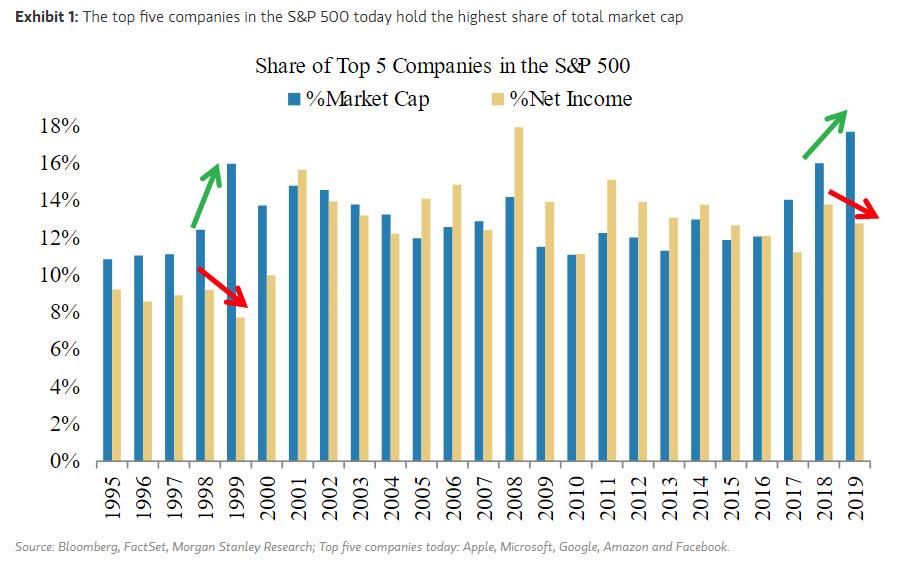
So the top five hold 18% of the index, but account for 14% of the net income for said index.
Alright, I can live with that.
For today.
Ghost of Igloi wrote:
Top five stocks 17.34% of the index. Distortion is even greater when you add up the market cap of the top dozen. Over 400 have weightings under 0.25%. Market cap of Apple and Microsoft higher than the entire German stock market.
I don’t know what your point is. Nothing you’ve said suggests one should avoid these specific stocks or the S&P.
Nothing will change what you think, so buy them with both hands. Makes no difference to me.
Huh?? wrote:I don’t know what your point is. Nothing you’ve said suggests one should avoid these specific stocks or the S&P.
Let me attempt to explain.
What Igy is showing with the chart is that earnings are down, fairly significantly, relative to market value, for the biggest stocks moving the market. The current trend (past few years) resembles that of the lead up to 2000. Therefore, if there was a strong causative relationship between low relative P/E for the market movers (or, in other words, inflated price relative to intrinsic value), and unless "things are different," then this trend is suggestive of a coming correction.
Igy is making a good point (if the data behind the chart are accurate). We each get to choose how we weigh this point in our own investing decisions, but nitpicking the point is childish, or ignorant (willfully or not) or both.
the idiot wrote:
Huh?? wrote:I don’t know what your point is. Nothing you’ve said suggests one should avoid these specific stocks or the S&P.
Let me attempt to explain.
What Igy is showing with the chart is that earnings are down, fairly significantly, relative to market value, for the biggest stocks moving the market. The current trend (past few years) resembles that of the lead up to 2000. Therefore, if there was a strong causative relationship between low relative P/E for the market movers (or, in other words, inflated price relative to intrinsic value), and unless "things are different," then this trend is suggestive of a coming correction.
Igy is making a good point (if the data behind the chart are accurate). We each get to choose how we weigh this point in our own investing decisions, but nitpicking the point is childish, or ignorant (willfully or not) or both.
The trend you are referring to did not happen at all prior to the 2008/2009 correction. ANd when it did happen in the 2000 correction, the degree of magnitude bears no comparison - the disparity was easily double or more what it is today. Look at the disparity of 1999 and it is orders of magnitude greater than today.
Ghost of Igloi wrote:
Nothing will change what you think, so buy them with both hands. Makes no difference to me.
If it makes no difference, why do you keep talking about it?
Accompanying the referenced chart:
“Currently, the top five companies in the S&P 500 (the other 1 percenters) make up 18% of the total market cap.
A ratio like this is unprecedented, including during the tech bubble. During 2019, the net income concentration for the 1 percenters didn’t keep pace with their market cap concentration, similar to what happened during the 1999 concentration peak.
I think this divergence is the result of the extraordinary liquidity being provided by the world’s central banks, which is flowing to the most liquid and largest names in the S&P 500. This also recalls 1999, when the Fed expanded its balance sheet at the end of the year and early in 2000 as a precaution against Y2K disruption.
The bottom line: this income/market cap divergence looks likely to continue over the near term, given the Fed’s expected balance sheet expansion through April. More importantly, if we’re right, these companies will then need to deliver on the income side of the inequality divide or risk a sharp decline in price.”
—Mike Wilson, Morgan Stanley Chief Investment Strategist
The SPX has, for decades, been largely driven by 10 or so stocks...this is nothing new.
I'm pulling this out of the air and don't stand by it, but I believe that you can get something like 90% of the SPX performance by owning just the 6 or 8 largest stocks in the index.
Seven indexes on our world watch list posted gains through January 13, 2020. The top performer is Hong Kong's Hang Seng with a gain of 1.44%. China's Shanghai is in second with a gain of 0.98% and in third is our own S&P 500 with a gain of 0.93%. Coming in last is France's CAC 40 with a loss of 0.09%.
agip wrote:
The SPX has, for decades, been largely driven by 10 or so stocks...this is nothing new.
That's not the point agip, that's the same everywhere in every financial market everywhere (and most aspects of life) where a small number count for a big proportion. If you focus on that aspect you'll completely miss the point. Agree with the significance or not, the observation of markedly low earnings relative to market cap is seen as unusual (and alarming to some).
It's not seen as "unusal". Look at 1995. Look at 1996. Look at 1997. Look at 1998. Only in 1999 did it go to an extreme level.
Look at 2019 - it looks more in line with 1995 through 1998.
Do you see that in 1999, the net income/market cap went extreme. THe levels today are less than half that ratio seen in 1999.
And think about that year - 2019 - big multinationals like APple, MSFT, Google are going to get effected more by the tarifs than are smaller, more US oriented companies. Perhaps that might explain their lower relative Net income for that year.
Ghost of Igloi wrote:
https://www.zerohedge.com/s3/files/inline-images/top%20five%20companies%20spx_0.jpg?itok=IFsPLcpm
It's not seen as "unusal". Look at 1995. Look at 1996. Look at 1997. Look at 1998. Only in 1999 did it go to an extreme level.
Look at 2019 - it looks more in line with 1995 through 1998.
Do you see that in 1999, the net income/market cap went extreme. THe levels today are less than half that ratio seen in 1999.
And think about that year - 2019 - big multinationals like APple, MSFT, Google are going to get effected more by the tarifs than are smaller, more US oriented companies. Perhaps that might explain their lower relative Net income for that year.
The top 5 in 1999 were; MSFT, GE, CSCO, WMT and XOM. They were 16.83% of S&P 500 but only accounted for 8.7% of GAAP income. ( $34.606 billion of $397.122 billion )
Current top 5; APPL, MSFT, GOOGL-GOOG, AMZN and FB are 17.38% of S&P 500; but they account for 14.3% of TTM GAAP income. ( $158.335 billion of $1106.844 billion )
Incidentally, the top 5 of 1999 all had net income increases in 2000. Yet; MSFT -62.85%, GE -6%, CSCO -28.59%, WMT -22.79%, and XOM +10.24%. MSFT and WMT were replaced in the top 5 by PFE and C. ( New order: GE, XOM, PFE, C, CSCO )
the idiot wrote:
agip wrote:
The SPX has, for decades, been largely driven by 10 or so stocks...this is nothing new.
That's not the point agip, that's the same everywhere in every financial market everywhere (and most aspects of life) where a small number count for a big proportion. If you focus on that aspect you'll completely miss the point. Agree with the significance or not, the observation of markedly low earnings relative to market cap is seen as unusual (and alarming to some).
well it's *a* point, if not *your* point.
But regardless, clearly the stock market is saying that earnings will rise over the next 24 months, and those rising earnings will justify the current rise in stock prices.
Looking at slowing earnigns growth over the past 12 months isn't going to tell you much.
New point - small caps have been moving up sharply. That's a sign of confidence in the market.
agip wrote:well it's *a* point, if not *your* point.
Well, OK, but I think you're choosing to interpret Igy's input in a way different than he intended. So if we are debating / discussing *his* point, one of us has missed the mark. Could be me.
agip wrote:
the idiot wrote:
That's not the point agip, that's the same everywhere in every financial market everywhere (and most aspects of life) where a small number count for a big proportion. If you focus on that aspect you'll completely miss the point. Agree with the significance or not, the observation of markedly low earnings relative to market cap is seen as unusual (and alarming to some).
well it's *a* point, if not *your* point.
But regardless, clearly the stock market is saying that earnings will rise over the next 24 months, and those rising earnings will justify the current rise in stock prices.
Looking at slowing earnigns growth over the past 12 months isn't going to tell you much.
New point - small caps have been moving up sharply. That's a sign of confidence in the market.
Well now, “the market” has less ability to predict the future than CAPE 10, Wall Street, or John Hussman. If anything the markets rise in recent years obviously the result of central bank activism. Now we can argue whether or not that is a good thing. In my view blowing ever bigger stock market bubbles in order to prevent the natural course of a business cycle has unintended consequences that are political as well as economic.
the idiot wrote:
agip wrote:well it's *a* point, if not *your* point.
Well, OK, but I think you're choosing to interpret Igy's input in a way different than he intended. So if we are debating / discussing *his* point, one of us has missed the mark. Could be me.
to be clear, Agip posted his comment immediately following Igy posting this:
Ghost of Igloi wrote:
Accompanying the referenced chart:
“Currently, the top five companies in the S&P 500 (the other 1 percenters) make up 18% of the total market cap.
A ratio like this is unprecedented, including during the tech bubble. ....
—Mike Wilson, Morgan Stanley Chief Investment Strategist
The article goes on to discuss the net income/market cap disparity, but it clearly starts with a statement to which Agip responded.
grazie PNW man