ataglance wrote:
Soooo sooo dirty
https://pbs.twimg.com/media/Bl-zrYCCAAAWxlI.png:large
Why don't you redo your graph with a proper time scale. If you don't know how to do it send me the spreadsheet and I'll fix it for you.
You're welcome.
ataglance wrote:
Soooo sooo dirty
https://pbs.twimg.com/media/Bl-zrYCCAAAWxlI.png:large
Why don't you redo your graph with a proper time scale. If you don't know how to do it send me the spreadsheet and I'll fix it for you.
You're welcome.
Influx of African talent around 1990s explains it all.
A similar curve for European/American runners together would
give a different picture!
1960 28:18.8 Pyotr Bolotnikov RUS
1962 28:18.1 Pyotr Bolotnikov RUS
1963 28:15.5 Ron Clarke AUS
1965 27:39.9 Ron Clarke AUS
1966 27:54.0 Ron Clarke AUS
1968 27:49.4 Ron Clarke AUS
1969 28:03.6 Ron Clarke AUS
1970 28:06.2 Dave Bedford GBR
1971 27:47.0 Dave Bedford GBR 2)27:52.8 Vaatainen
1972 28:38.4 Lasse Viren FIN
1973 27:30.8 Dave Bedford FIN
1974 27:43.6 Steve Prefontaine USA
1975 27:45.4 Brendan Foster GBR 2) 27:45.9 Shorter
1976 27:40.4 Lasse Viren FIN 2) 27:42.6 Lopes
1977 27:30.5 Samson Kimobwa KEN 3) 27:37.1 Rono
1978 27:22.5 Henry Rono KEN 2) 27:30.3 Foster
1979 27:36.8 Karl Fleschen GER 2)27:39.4 Virgin
1980 27:29.2 Craig Virgin USA 2) 27:31.7 Rono
1981 27:27.7 Fernando Mamede POR 4)27:40.7 Salazar
1982 27:23.0 Fernando Mamede POR 2)27:24.4 Lopes 3) 27:25.6 Salazar
1983 27:23.4 Carlos Lopes POR
1984 27:13.8 Fernando Mamede POR 4)27:40.6 Nenow
1985 27:37.2 Bruce Bickford USA 2) 27:40.8 Nenow
1986 27:20.6 Mark Nenow USA
1987 27:27.0 Francesco Panetta ITA
1988 27:21.5 Brahim Boutayeb MOR
1989 27:08.2 Arturo Barrios MEX
1990 27:18.2 Arturo Barrios MEX 2) 27:19.2 Ngugi
1991 27:11.2 Richard Chelimo KEN 2) 27:11.6 Ngugi
1992 27:14.3 Fita Bayissa ETH
1993 27:58.4 Yobes Ondieki KEN 6) 27:18.4 Tergat
1994 26:52.4 William Sigei KEN 2) 27:15.0 Gebrselassie
1995 26:43.5 Haile Gebrselassie ETH
1996 26:38.1 Salah Hissou MAR 2) 26:54.4 Tergat 4) 27:07.3 Gebrselassie
1997 26:27.9 Paul Tergat KEN 2)26:31.3 Gebrselassie
1998 26:22.7 Haile Gebrselassie ETH 2) 26:46.4 Tergat
1999 26:51.5 Charles Kamathi KEN
2000 27:03.9 Paul Tergat KEN
2001 27:04.2 Abraham Chebii KEN 4)27:14.01 Keflezighi
2002 26:49.4 Sammy Kipketer KEN
2003 26:29.2 Haile Gebrselassie ETH 4)26:49.6 Bekele
2004 26:20.3 Kenenisa Bekele ETH 2) 26:39.7 Sihine 3) 26:41.6 Gebrselassie
2005 26:17.5 Kenenisa Bekele ETH 4) 26:41.8 Wanjiru
2006 26:35.6 Micah Kogo KEN 2) 26:37.3 Tadese
2007 26:46.2 Kenenisa Bekele ETH 2)26:48.7 Sihine
2008 26:26.0 Kenenisa Bekele ETH 2) 26:50.5 Sihine 3) 26:51.2 Gebrselassie
2009 26:46.3 Kenenisa Bekele ETH
2010 26:56.7 Josphat Kiprono Menjo KEN 2) 26:59.6 Solinsky 5) 27:10.7 Rupp
2011 26:43.1 Kenenisa Bekele ETH 3)26:46.5 Farah 3) 26:48.0 Rupp
2012 26:51.1 Emmanuel Bett KEN
2013 26:51.0 Dejene Gebremeskel ETH
ataglance wrote:
The 1500
https://twitter.com/Phil_Hurst1/status/459386282880151553/photo/1
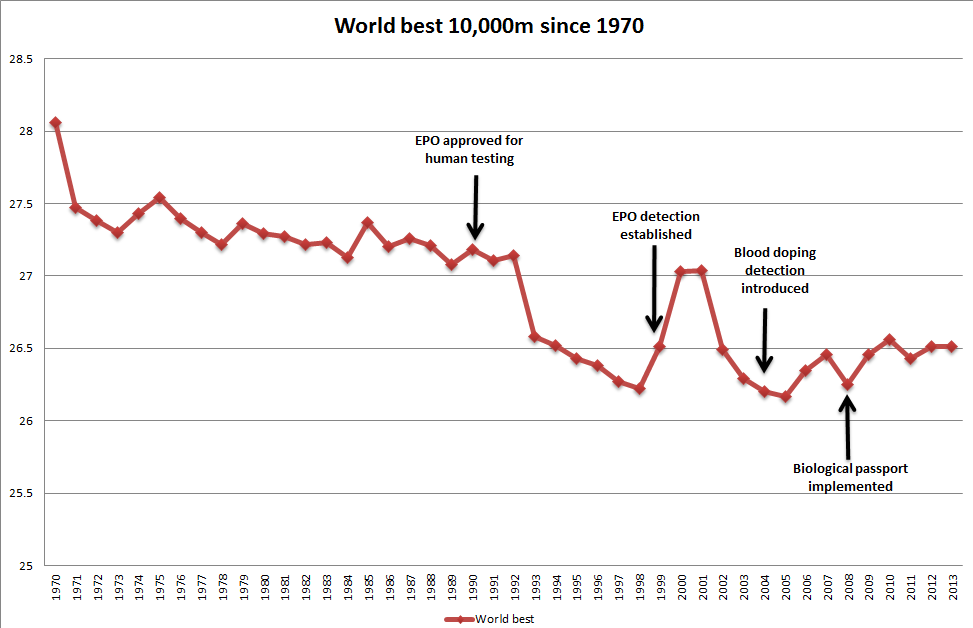
The crappy formatting aside, why do you denote the date of clinical trials (91) when the date the EPOGEN was improved (1993) is what matters?
I didnt make these charts or do the research, I just saw them on a twitter feed.
yyy wrote:
Influx of African talent around 1990s +EPO+greedy european doctors ,coaches and agents explains it all.
fyp
malmo wrote:
The world record was 27:39 set in 1965 (on cinders). i don't know what you are talking about (neither do you) cinders being "phased out" -- by 1970 virtually no one was running on cinders, especially at the championship/international level.
Yes, and Ron Clarke's world record for 10000m is one of the greatest athletic performances of all time.
I cannot comment for the US, but international meets over 10000m were definitely still being held in Europe on cinders in the early 70s. For example, take a look at Dave Bedford setting the European record over 10000m in an international meet on cinders in 1971:
http://www.youtube.com/watch?v=kraiMbRQtFcmalmo wrote:
it's clear that the guy who created the graph isn't very good at using Excel. He converts 27:30 to 27.3. So 27:59 will convert to 27.6. 28:00 will be 28.0
Compare annual 10k bests 1980-2005 to the graph.
http://www.gbrathletics.com/tp/worm.htm
Thanks for pointing that out, I was thinking that the graph was made up of average times of the best few yearly performers as the scaling and figures did not make any sense at a first quick glance.
Historian wrote:
I cannot comment for the US, but international meets over 10000m were definitely still being held in Europe on cinders in the early 70s. For example, take a look at Dave Bedford setting the European record over 10000m in an international meet on cinders in 1971:
http://www.youtube.com/watch?v=kraiMbRQtFc
Nice video but that doesn't change the fact that by the early 70s virtually all races of stature were run on modern synthetic or quasi-modern synthetic (rubberized asphalt) tracks.
Care to posts the videos of hundreds of Euro Meets run on synthetic, including this one, Bedford's next 10,000?
http://www.youtube.com/watch?v=mwyA3sfEED4In 1970 I was 15 years old.. I had only seen one cinder track (Univ. of Maryland, soon to be paved). In 1977 I actually race on a cinder track (Rutgers) and again in 1978 (Keuruu, Finland). Never seen one since. Scanning on Track and Field News of the early 70s cinder tracks are already a novelty.
malmo wrote:
ataglance wrote:Soooo sooo dirty
https://pbs.twimg.com/media/Bl-zrYCCAAAWxlI.png:largeWhy don't you redo your graph with a proper time scale. If you don't know how to do it send me the spreadsheet and I'll fix it for you.
Fortunately that graph has already been made and includes a top-20 average as well:
http://www.sportsscientists.com/2009/08/performance-analysis-a-weapon-against-doping/I ain't no statistician ....
but smoothing out the peaks and troughs, the gradients look to be reasonably consistent over the time frame. And why do they stop at 2000, for an article that came out in late 2009?
HardLoper wrote:
Fortunately that graph has already been made and includes a top-20 average as well:
http://www.sportsscientists.com/2009/08/performance-analysis-a-weapon-against-doping/
Yes, that graph has already been made right here on this message board, with more detail. By me. All distance events 1/10/20/50/100 deep with trendlines. If you can't find them I'll see if I can find the graphs and repost.
malmo wrote:
HardLoper wrote:Fortunately that graph has already been made and includes a top-20 average as well:
http://www.sportsscientists.com/2009/08/performance-analysis-a-weapon-against-doping/Yes, that graph has already been made right here on this message board, with more detail. By me. All distance events 1/10/20/50/100 deep with trendlines. If you can't find them I'll see if I can find the graphs and repost.
I can find simple WR progression charts and high school charts from you but not this one. That would be neat to see.
10,000m
5000m
Marathon
Fascinating, thanks for posting those, Malmo.
3000m SC
1500m
coud you make similar plots with European and American runners only?