10 Final Observations On The 2017 Cross Country Championships Including A Look At The Biggest Chokers and Overachievers

By LetsRun.com
November 20, 2017
The 2017 NCAA Cross Country Championships are in the books as they took place on Saturday in Louisville. Catch our men’s and women’s recap and analysis articles now if you didn’t read them on Saturday. However, the 5,500 words written in Kentucky weren’t enough. We’ve 3,000+ words worth of final observations about the 2017 NCAA Cross Country Champs below.
1. New Mexico’s front four was incredible on Saturday
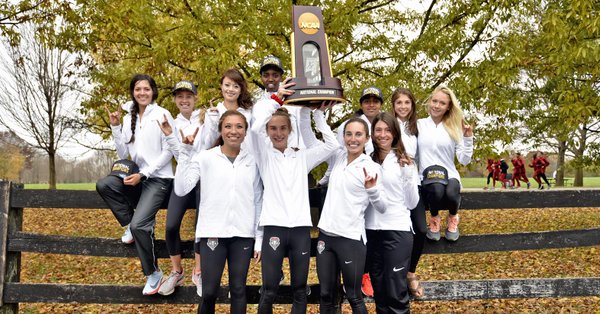 New Mexico celebrates. Photo via @UNMLoboXCTF
Until 2015, only two women’s teams had ever put four women in the top 15 at NCAAs. These two:
1981 Virginia (3. Aileen O’Connor, 5. Lesley Welsh, 8. Lisa Welsh, 12. Jill Haworth)
1993 Arkansas (6. Deena Drossin, 8. Megan Flowers, 9. Shelley Taylor, 14. Sarah Schwald)
Virginia turned the trick during the very first NCAA women’s XC championship, back when women’s collegiate running was still in its infancy. Arkansas did it 12 years later, led by Deena Drossin (you may know her better as Deena Kastor), though amazingly that was not good enough to win the meet as Arkansas scored 71 to champion Villanova’s 66.
Now New Mexico has accomplished the feat twice in three years.
2017 New Mexico (1. Ednah Kurgat, 7. Weini Kelati, 12. Charlotte Prouse, 14. Alice Wright)
2015 New Mexico (4. Courtney Frerichs, 5. Alice Wright, 13. Rhona Auckland, 15. Calli Thackery)
One more note about New Mexico. Heading into this year’s meet, there were questions about the Lobos’ depth. And though they had only the fourth-best #5 runner, they had the fastest 6th (Alex Buck, 105th) and 7th (Kieran Casey, 123rd) women in the field as well as the fastest #1, #3, and #4.
2. Turnaround of the year: How did the Portland men go from 13th in 2016 to 2nd in 2017?
Last year, the Pilots finished 13th; their top finisher, senior Brady Johnson, was 69th. Then they graduated five of their top six runners. On Saturday, Portland finished second; Logan Orndorf was 64th and he didn’t even score for UP. How did they do it?
First, the two guys they did return from their 2016 NCAA squad got a lot better. Jeff Thies (70th in ‘16) became an All-American in the 1500 last spring (7th) and was a stud all fall, taking 8th at Wisconsin and 14th at NCAAs. And Nick Hauger (154th in ‘16) built on the potential he showed last fall by taking 3rd at WCCs and 6th at the West Regional by finishing 26th.
Portland’s other three scorers on Saturday consisted of two new additions and a blue-chip stud:
- Emmanuel Roudolff-Levisse (11th): The 22-year-old Frenchman was the bronze medalist at the European U23 champs in the 10,000 this summer before enrolling at Portland with a 29:08 pb.
- Matt Welch (46th): A fifth-year transfer, Welch finished second at Roy Griak last year for Minnesota and 13th at Big 10s. This year, he was training with Portland’s top group early in the season but an Achilles injury prevented him from racing until NCAAs. But for him to finish 46th is pretty remarkable considering he didn’t make NCAAs last year and was 243rd in 2015.
- Caleb Webb (54th): Webb, who attended Big Bear High School (Ryan Hall’s alma mater) was a two-time California state champ in XC who finished 3rd at NXN as a senior in 2014. The following spring, he ran 8:47 for 3200 meters to win the California state meet. After redshirting as a freshman and finishing 27th at WCCs last fall, Webb started to hit on his potential by running 14:00 this spring and carried it over with a solid XC season.
3. NAU’s Peter Lomong went from a 4:30/10:01 guy in HS to 8th at NCAA XC
In our post-race recap, we mentioned how Northern Arizona’s Tyler Day went from a high school runner with PRs of 4:20 and 9:28 to 3rd in the country on Saturday. What we did not mention was his teammate, Peter Lomong, went from a high school runner with PRs of 4:30 and 10:01 to 8th in the country.
Those PRs don’t tell the whole story with Lomong. Obviously, as the younger brother of two-time Olympian Lopez Lomong, Peter has good genes. And one of the reasons he wasn’t faster at 1600/3200 was because he mainly focused on shorter distances in HS: he ran 49.65/1:56.19 in the 400/800, 42.15 in the 300 hurdles, and even dabbled in the 55m hurdles (8.83). He did run a 5k PR of 15:45 in XC, but he was 144th at Foot Locker South as a senior. Clearly Lomong has improved his aerobic capacity tremendously since arriving in Flagstaff.
One more fun fact: Lomong, Day, and Stanford’s Grant Fisher all graduated HS in 2015. Fisher may still have the brightest future, but it’s crazy to think that, on Saturday, the top U.S. finisher wasn’t the two-time FL champ/sub-4:00 high schooler but another guy from his same class who never broke 4:20 or 9:20 in HS.
4. Who are the early favorites for 2018?
Here’s what the men’s podium teams return next year:
1. Northern Arizona: Returns 5/7 (#1, #2, #3, #5, #6)
Fourth man Andy Trouard is gone, but with three returners from the top eight plus one of the top freshmen in the country (Luis Grijalva, who was 60th but didn’t score), the Lumberjacks will be favorites again next fall.
UPDATE: NCAA runner-up Matt Baxter was listed in the NCAA results on TFRRS as a junior but was also listed as a junior in the TFRRS results last year. When we checked NAU’s online roster after the race on Saturday, Baxter was listed as a senior, but the NAU website has since been updated and now lists Baxter as a junior. We have confirmed with NAU that Baxter does indeed have XC eligibility next year.
MB: Matt Baxter NAU
2. Portland: Returns 5/7 (#1, #3, #5, #6, #7)
Jeff Thies (14th) and Matt Welch (46th) are the casualties.
3. BYU: Return 5/7 (#2, #3, #4, #5, #7)
Losing their top man from NCAAs, freshman sensation Casey Clinger (24th) to a mission for two years hurts, but the majority of a deep team returns for another run in 2018.
4. Stanford: Returns 7/7
Head coach Chris Miltenberg has led the Cardinal to four straight podium appearances, but Stanford will be aiming higher in 2018. All seven men from this year’s team returns next fall, led by individual 5th-placer Grant Fisher. Plus Stanford gets back Thomas Ratcliffe (7:53 3k).
And here is what the women’s podium teams return next year:
1. New Mexico: Returns 5/7 (#1, #2, #3, #5, #6)
Alice Wright (14th), a part of three podium teams and two national champs at UNM, is gone, but New Mexico returns three women from the top 12. If they can add another key transfer or develop the back end of the roster, the Lobos could challenge for a third NCAA title in four years.
2. San Francisco: Returns 4/7 (#2, #3, #6, #7)
The Dons will take some graduation hits, losing three scorers, including 2017 NCAA 10k champ Charlotte Taylor (3rd). But 5th placer Weronika Pyzik will be back to lead the team in 2018.
3. Colorado: Returns 5/7 (#1, #2, #4, #5, #7)
Kaitlyn Benner (37th) is the only scorer who will not return, setting the stage for a fourth straight podium appearance.
4. Stanford: Returns 4/7 (#1, #4, #5, #7)
Vanessa Fraser (27th) and Elise Cranny (57th) are out of XC eligibility, but Stanford gets back 13th placer Fiona O’Keeffe and 4:08 1500 woman Christina Aragon (67th). If Courtney Smith (who sat out this fall but has run 32:08 for 10k) can stay healthy and Nevada Mareno (two-time FL top-3 finisher) can contribute as expected, this team should vie for the national title next year.
5. Get All-American in 2017, bomb in 2018?
One thing about running that we always say is not talked about enough is that when an athlete has an incredible season, it’s important for them to realize that probably nearly everything went right. As a result, many times after a big breakthrough, the following year won’t be as good as it’s hard for everything to go right two years in a row. Yes, dominant stars like Mo Farah or Edward Cheserek often stay on top but people need to realize that it’s easier for them to do so as running results often are like a bell curve – the best people are often way better than the others. Case in point: in the women’s NCAA meet this year, the 10th placer was closer in terms of time to the 42nd place finisher than she was to the 1st place finisher. In the men’s race, the 10th placer was closer to the 58th finisher than they were to 1st.


For mere mortals, it’s often tough to top a top performance. For proof, we decided it would be fun to look at all of the returning All-Americans from the 2016 NCAA meet (top 40) and see how many of them improved on their performance from 2016 in 2017. The numbers were fascinating. For the men, of the 18 returning underclassmen All-Americans from 2016, exactly half of them either ran worse or didn’t even compete in 2017. For the women, the numbers were even more depressing. Of the 30 returning All-Americans from 2016, just five of them (16.7%) finished higher in 2017 than they did in 2016. The other 25 (83.3%) either didn’t run or finished worse this year than last.
Men
| 2016 Place | Athlete | Yr | School | 2017 Place | Difference |
| 2 | Knight, Justyn | JR | Syracuse | 1st | 1 spot better |
| 5 | Fisher, Grant | SO | Stanford | 5th | same |
| 7 | McDonald, Morgan | JR | Wisconsin | DNC | N/A |
| 11 | Baxter, Matthew | JR | NAU | 2nd | 9 spots better |
| 12 | Maggard, Dillon | JR | Utah State | 6th | 6 spots better |
| 15 | George, Alex | JR | Arkansas | 41st | 36 spots worse |
| 16 | Abdi, Hassan | JR | Ok.State | 47th | 31 spots worse |
| 17 | Bennie, Colin | JR | Syracuse | 56th | 39 spots worse |
| 18 | Uchikoshi, Yusuke | JR | Boise State | 217th | 199 spots worse |
| 19 | Bruce, Jack | JR | Arkansas | 13th | 6 spots better |
| 23 | Day, Tyler | SO | NAU | 3rd | 20 spots better |
| 26 | Kipkoech, Lawrence | SO | Campbell | 9th | 17 spots better |
| 28 | Klecker, Joe | FR | Colorado | 67th | 39 spots worse |
| 29 | Maton, Matthew | SO | Oregon | DNC | N/A |
| 30 | Williams, Michael | JR | Wash. St. | 70th | 40 spots worse |
| 32 | Linkletter, Rory | SO | BYU | 39th | 7 spots worse |
| 33 | Dressel, John | SO | Colorado | DNC | N/A |
| 37 | Trouard, Andy | JR | NAU | 35th | 2 spots better |
| 40 | Choge, Jacob | FR | Mid. Tenn. State | 34th | 6 spots better |
Women
| 2016 Place | Athlete | Yr | School | 2017 Place | Difference |
| 1 | Schweizer, Karissa | JR | Missouri | 11th | 10 spots worse |
| 3 | Rohrer, Anna | SO | Notre Dame | DNC | N/A |
| 4 | Rainsberger, Katie | FR | Oregon | 16th | 12 spots worse |
| 5 | Lokedi, Sharon | SO | Kansas | 44th | 39 spots worse |
| 6 | Peloquin, Brenna | SO | Boise State | DNC | N/A |
| 7 | Purrier, Elinor | JR | N. Hampshire | 18th | 11 spots worse |
| 8 | Neale, Amy-Eloise | JR | Washington | 2nd | 6 spots better |
| 10 | Taylor, Charlotte | JR | San Francisco | 3rd | 7 spots better |
| 11 | Receveur, Katherine | SO | Indiana | 20th | 9 spots worse |
| 14 | Cash, Alli | JR | Oregon | 166th | 152 spots worse |
| 15 | Chikotas, Elizabeth | JR | Penn State | DNC | N/A |
| 16 | Werner, Taylor | FR | Arkansas | 104th | 88 spots worse |
| 18 | Evenson, Avery | JR | Michigan | 157th | 139 spots worse |
| 19 | Wright, Alice | JR | New Mexico | 14th | 5 spots better |
| 22 | Jones, Dani | SO | Colorado | 10th | 12 spots better |
| 23 | Bilo, Peyton | SO | Cal Poly | DNC | N/A |
| 24 | McDermitt, Jordann | JR | Eastern Michigan | 78th | 54 spots worse |
| 25 | Koon, Rachel | SO | North Carolina St. | 82nd | 57 spots worse |
| 26 | Benner, Kaitlyn | JR | Colorado | 36th | 10 spots worse |
| 27 | Kempfer, Jamie | JR | Missouri | DNC | N/A |
| 29 | LaRocco, Lauren | JR | Portland | DNC | N/A |
| 30 | Sereno, Gina | JR | Michigan | 28th | 2 spots better |
| 31 | Imer, Charlotte | JR | Eastern Kentucky | 52nd | 21 spots worse |
| 33 | Kunc, Katy | JR | Kentucky | 41st | 8 spots worse |
| 34 | Birk, Erica | SO | BYU | DNC | N/A |
| 35 | Smith, Courtney | JR | Harvard | DNC | N/A |
| 36 | Hunsberger, Jillian | JR | Penn State | 75th | 39 spots worse |
| 37 | O’Keeffe, Fiona | FR | Stanford | 13th | 24 spots better |
| 38 | Aragon, Christina | FR | Stanford | 67th | 29 spots worse |
| 39 | Caldwell, Mackenzie | SO | Colorado | DNC | N/A |
| 40 | Hurta, Sage | FR | Colorado | 35th | 5 spots better |
6. Who exceeded or failed to meet preseason expectations?
We went back and looked at the preseason rankings to see how teams did or didn’t live up to expectations. The analysis is pretty interesting. As much as we want to believe in rags to riches stories, they don’t really happen.
There was only one men’s team at NCAAs that didn’t receive a vote in the preseason poll — Utah State — and they ended up 27th. On the women’s side, there were five teams that received no votes in the preseason poll but only one of them ended up in the top 20 — Georgia, who was 17th — with the others being Cal (22nd), E. Kentucky (23rd), Columbia (28th), and Dartmouth (29th).
The Michigan men began the year unranked (but 33rd most votes) and ended up 10th and the Furman women started unranked (but 34th) and ended up 7th.
Of the teams actually ranked in the top 30 in the preseason, the biggest overachiever for the men was Portland who was ranked 14th in the preseason but ended up 2nd. For the women, the biggest mover up was Boise St., who started 19th but ended up 6th.
Looking at the top 20 teams in the rankings in the preseason, 17 on the men’s side (85%) and 18 on the women’s side (90%) made it to the meet.
A comparison of the men’s pre-season rankings and their finish at the 2017 NCAA Cross Country Championships
Note: Teams below 30 technically weren’t ranked but we ranked everyone with votes.
| Rank | School | NCAA Finish | Difference |
| 1 | NAU | 1st | same |
| 2 | Stanford | 4th | 2 spots worse |
| 3 | Syracuse | 13th | 10 spots worse |
| 4 | Arkansas | 5th | 1 spots worse |
| 5 | Colorado | 8th | 3 spots worse |
| 6 | BYU | 3th | three better |
| 7 | Wisconsin | DNC | More than 24 spots worse |
| 8 | Iona | 12th | 4 spots worse |
| 9 | Oregon | 6th | 3 spots better |
| 10 | Ok State | 29th | 19 spots worse |
| 11 | Wash St | 24th | 13 spots worse |
| 12 | Iowa St. | 7th | 5 spots better |
| 13 | UVA | 16th | 3 spots worse |
| 14 | Portland | 2nd | 12 spots better |
| 15 | S. Utah | 11th | 4 spots better |
| 16 | Georgetown | DNC | More than 15 spots worse |
| 17 | Furman | 26th | 9 spots worse |
| 18 | Ole Miss | 18th | same |
| 18 | Colorado St. | 9th | 9 spots better |
| 20 | Tulsa | DNC | More than 12 spots worse |
| 21 | Mid. Ten. | 23rd | 2 spots worse |
| 22 | E. Michigan | DNC | More than 9 spots worse |
| 23 | Michigan St. | 25th | 2 spots worse |
| 24 | Boise St. | 19th | 5 spots better |
| 25 | UCLA | 21st | 4 spots better |
| 26 | V. Tech | 20th | 6 spots better |
| 27 | Illinois | DNC | More than 4 spots worse |
| 28 | NC State | 17th | 11 spots better |
| 29 | Columbia | DNC | More than 2 spots worse |
| 30 | Texas | 30th | same |
| 31 | Navy | 31st | same |
| 32 | UTEP | DNC | NA |
| 33 | Michigan | 10th | 23 spots better |
| 34 | Air Force | 15th | 19 spots better |
| 35 | Cal | DNC | NA |
| 36 | Providence | DNC | NA |
| 37 | Washington | 22nd | 15 spots better |
| 38 | Indiana | DNC | NA |
| 39 | Alabama | 14th | 25 spots better |
| 40 | Princeton | 28th | 12 spots better |
| 41 | Minnesota | DNC | NA |
A comparison of the women’s pre-season rankings and their finish at the 2017 NCAA Cross Country Championships
| Rank | School | NCAA Finish | Difference |
| 1 | Colorado | 3rd | 2 spots worse |
| 2 | Oregon | 5th | 3 spots worse |
| 3 | Michigan | 9th | 6 spots worse |
| 4 | New Mexico | 1st | 3 spots better |
| 5 | Stanford | 4th | 1 spot better |
| 6 | NC State | 8th | 2 spots worse |
| 7 | Providence | 16th | 9 spots worse |
| 8 | Notre Dame | DNC | More than 23 spots worse |
| 9 | BYU | 11th | 2 spots worse |
| 10 | San Francisco | 2nd | 8 spots better |
| 11 | Penn State | 18th | 7 spots worse |
| 12 | Arkansas | 13th | 1 spot worse |
| 13 | Washington | 21st | 8 spots worse |
| 14 | Wisconsin | 10th | 4 spots better |
| 15 | Missouri | DNC | More than 16 spots worse |
| 16 | Mich. State | 15th | 1 spot better |
| 17 | E. Michigan | 27th | 10 spots worse |
| 18 | Ole Miss | 25th | 7 spots worse |
| 19 | Boise St. | 6th | 12 spots better |
| 20 | Villanova | 12th | 8 spots better |
| 21 | Ok. State | 30th | 9 spots worse |
| 22 | Utah | DNC | More than 9 spots worse |
| 23 | Miss State | DNC | More than 8 spots worse |
| 24 | Minnesota | 19th | 5 spots better |
| 25 | Harvard | DNC | More than 6 spots worse |
| 26 | Georgetown | DNC | More than 5 spots worse |
| 27 | Iowa St. | 20th | 6 spots better |
| 28 | Louisville | DNC | More than 3 spots worse |
| 29 | Air Force | DNC | More than 2 spots worse |
| 30 | Yale | DNC | More than 1 spot worse |
| 31 | W. Virginia | DNC | At least 1 spot worse |
| 32 | Portland | DNC | NA |
| 33 | Utah State | 14th | 20 spots better |
| 34 | Furman | 7th | 27 spots better |
| 35 | UCLA | DNC | NA |
| 36 | Vanderbilt | DNC | NA |
| 37 | Baylor | DNC | NA |
| 38 | Abilene Christian | DNC | NA |
| 39 | Indiana | 24th | 15 spots better |
| 40 | Syracuse | 26th | 14 spots better |
| 41 | Cornell | DNC | NA |
| 42 | Texas | 31st | 11 spots better |
7. Who bombed and surprised in the short term at NCAAs?
We also always try to compare the last rankings of the year to the teams’ finishes at NCAAs to see who over or underperformed in the short term at NCAAs. There were seven men’s teams and five women’s teams that finished more than five places lower than their position in the final USTFCCCA coaches’ poll. The biggest dropoff was the 7th-ranked Furman men, who bombed and finished 26th. There were five men’s teams and two women’s teams that finished more than five places higher than their position in the final USTFCCCA coaches’ poll. Leading the way were the 28th-ranked NC State men, who finished 17th.
The Alabama (ranked 24th, finished 14th) and Arkansas (ranked 15th, finished 5th) men also finished double digits ahead of their ranking. It’s worth noting that Alabama’s top three were so good (All-Americans in 4th, 7th and 30th in the team standings) that Alabama’s 4th and 5th could have walked the course and finished next to last and last and Alabama still would have been 19th overall.
Men’s teams that finished more than 5 spots worse than their rankings at NCAAs
3rd-ranked Syracuse finished 13th
7th-ranked Furman finished 26th
9th-ranked Virginia Tech finished 20th
11th-ranked Michigan State finished 25th
12th-ranked Washington finished 22nd
18th-ranked Oklahoma State finished 29th
21st-ranked Texas finished 30th
Men’s teams that finished more than 5 spots better than their rankings at NCAAs
13th-ranked Iowa State finished 7th
14th-ranked Oregon finished 6th
15th-ranked Arkansas finished 5th
19th-ranked Southern Utah finished 11th
24th-ranked Alabama finished 14th
20th-ranked Iona finished 12th
25th-ranked Ole Miss finished 18th
28th-ranked NC State finished 17th
28th-ranked Virginia finished 16th
Women’s teams that finished more than 5 spots worse than their rankings at NCAAs
6th-ranked Arkansas finished 13th
9th-ranked Providence finished 16th
10th-ranked Penn State finished 18th
14th-ranked Iowa State finished 20th
23rd-ranked Oklahoma State finished 30th
Women’s teams that finished more than 5 spots better than their rankings at NCAAs
12th-ranked Boise State finished 6th
17th-ranked Wisconsin finished 10th
8. It was an all-time great year for….
The following teams earned program-best finishes at NCAAs.
Men
Middle Tennessee St. – The Blue Raiders made NCAAs for the first time in 2016 and finished 28th. This year they improved to 23rd.
Portland – The Pilots had been to NCAAs 17 times before but never finished higher than 3rd. This year they were 2nd.
Southern Utah – In their fifth appearance at NCAAs, the Thunderbirds cracked the top 20 for the first time in a big way as they were 11th (previous best finish was 21st).
Utah State – They were 27th in their first trip to NCAAs.
Women
Boise State – In just their third trip to NCAAs, the Broncos finished 6th (previous best finish of 11th).
Eastern Kentucky – The Colonels finished 21st in their first trip to NCAAs.
Furman – The Paladins announced their arrival at NCAAs for the first time in a big way with a 7th-place showing.
San Francisco – In their fifth trip to NCAAs, the Dons finished 2nd (previous best was 6th last year).
Utah State – The Aggies were 14th in their first trip to NCAAs.
More: USTFCCCA: Historical finishes by teams at NCAA
9. Oh so close for Colorado State
The Colorado State Rams nearly scored a program-best finish in the men’s race as at 8k they were in 4th and just 2k away from their first podium finish (top 4). However, in the last 2k their star Jerrell Mock faded from 10th to 169th and the Rams faded from 4th to 9th – just one spot behind the big power in the state — Colorado — who was 8th.
“It was bittersweet,” coach Art Siemers said to the Denver Post after the race. “We had a dream season this year. We won our first Mountain West title in school history. We just had a really consistent year. … This year was really special. And the guys showed it today. We want to be a top 10 program in the country year-in and year-out. We really felt we could podium … At the end of the day, we were still top 10, even without our No. 1 guy.”
If you are looking for a blue-collar team full of Americans to root for, the Rams are your team. Take a look at the modest credentials of their top seven. These credentials pale in comparison to the type of recruit that ends up at powerhouse teams like Colorado or Stanford and yet the Rams almost beat them both.
Name – Yr – NCAA Place – HS PBs & Accolades – College PBs
1. Cole Rockhold – Jr – 34th – 4:13/9:07 in Missouri in HS. 3:41/7:59/13:52 in college.
2. Grant Fischer – Sr. – 58th – 4:26/9:30 at 5,000 feet of altitude. 25th at Nike Regionals. 13:46/28:45 in college.
3. Eric Hamer – Jr. – 90th – 4:18 at altitude/8:58 at sea level. 4th at NXN in 2014. 15:14/30:00 in college.
4. Wayde Hall – Sr. – 93rd – 5th-year grad transfer from Minnesota. Was goodt in HS — 4:10/9:06 in HS, won Minn state meet in XC — but at Minnesota last year he didn’t even make Big 10 final in 1500 and was just 69th in the conference meet in xc so he’s improved a ton very quickly. 3:50/4:09/8:32 at Minnesota.
5. Carson Hume – Jr. – 111th – 4:20/9:44 at altitude in Colorado in HS. 30th FL MW. 3:52/4:08/14:17 in college
6. Jerrell Mock – Sr. – 169th – 4:21/9:17 in HS at altitude in Utah. 12th at FL regionals. 13:44/28:11.
7. Trent Powell – Jr. – 175th – 4:13 in Wisconsin in HS. 4th in Wisconsin state meet in XC.
This year’s performance was far from a fluke. In track, Colorado State had four guys run 13:52 or faster last year.
10. Twin power, part II
Three weeks ago, we pointed out that twins Gabrielle and Danielle Orie of Cornell and Penn finished 7th and 8th at Heps in the exact same time of 21:20.0. That theme of twins finishing close together continued at NCAAs.
Twins Samantha and Jessica Drop of Georgia almost replicated that feat at NCAAs on Saturday as Samantha was 30th in 20:06.4 and Jessica was 31st in 20:06.9. Overall this year, the twins raced each other seven times this fall with Jessica coming out on top four times and Samantha three but this was the closest they’ve been to each other all year in terms of time. The gap between them in their 7 races this year starting at NCAAs and working back – 0.5, 4.5, 2.7, 1.7, 8.5, 5.2, 4.3.
The Drops weren’t the only twins competing on Saturday as Bethany Hasz of Minnesota finished 70th in 20:29.4, four places (and 1.7 seconds) ahead of twin sister Megan.
It’s interesting to wonder how one would have done if the other was not competing. Does the faster twin subconsciously hold back to stay with the slower twin?