Giovani wrote:
The sound of you realizing you were wrong after your little outburst. You actually don't even need to download them, just expand the table.
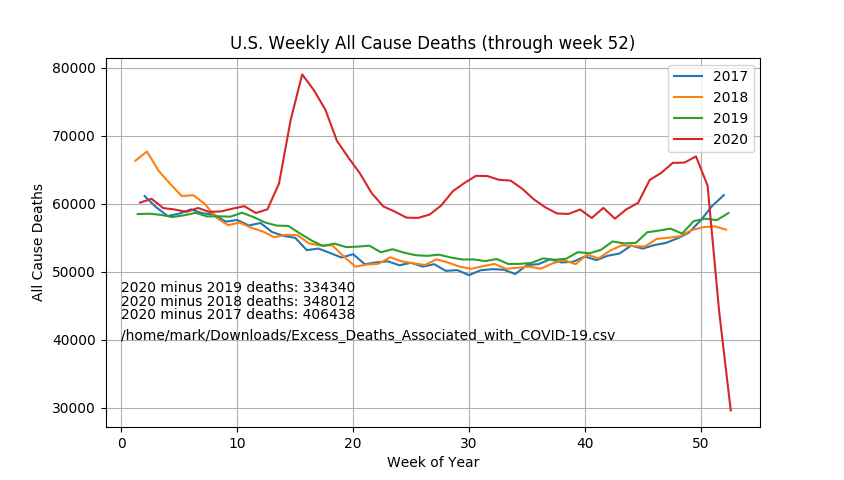
You're reading the table wrong. There's 3 columns.
Observed Number: number of deaths reported (this is not excess deaths)
Upper Bound Threshold: top of 95% confidence interval from their excess deaths model. Basically - above this level we are 95% confident that any more deaths are truly in excess of average
Average Expected Number of Deaths: average number of deaths for this week the model predicts. A less stringent excess death threshold than the upper bound.
You can calculate excess deaths by subtracted the Observed Number of deaths from either of the two thresholds to get two measures of expected deaths. They are actually reported in a tooltip if you hover over a week on the chart. You are given a percentage excess range that is (1 - (observed/upper bound)) to (1- (observed/average expected)).
You'll see only a few weeks in the dataset have deaths in excess of the upper bound threshold until 2020.. then basically every week does.