Re: Interesting post from Philosophical Economics
http://philosophicaleconomics.wordpress.com/2014/05/17/why-a-66-crash-would-be-better-than-a-200-melt-up/
Suppose that you’re a middle-aged professional with a 30 year retirement time horizon. You have 2 investment choices; purchase $10000 of SP Index once a year, same month, for the next 30 years beginning either September 30,1929, or April 30, 1984.(All dividends are reinvested) On 9/1929, the S&P is 31.30 and on 9/1959 it is 57.05. Annualized S&P 500 Price Return is 2.02% and the Annualized S&P 500 Return (Dividends Reinvested) is 7.63%. Your $10000 has grown to $90839. CAPE is 32.56. On 4/1984 S&P is 157.60 and on 4/2014 it is 1864.2. Annualized S&P 500 Price Return is 8.56% and the Annualized S&P 500 Return (Dividends Reinvested) is 11.16%. Your $10000 has grown to $239294. CAPE is 9.31 Seems like a no-brainer, the former didn't even double in price while in the latter the index had increased just short of 12x. The month after 9/1929 marked the beginning of the Great Depression while 4/1984 was the early stages of a great bull market. Yet the 9/30/1929 is the correct choice , $3,058,257 to $1,703,401. Philosophical Economics writes "The reason the plunge produces a better final outcome is that the valuation at which investors reinvest dividends... has a powerful impact on long-term total returns, an impact that increases non-linearly as valuations fall to depressed extremes. In the case of the plunge, the dividends are reinvested at roughly 1/9 the valuation of the bubble. Over 30 years, the accumulated effect of the cheap reinvestment is enough to fully make up for the one-time impact of a 9 bagger increase in valuation". (From 1929-1959 S&P dividend yield averaged 5.36&; 1984-2014 the average is 2.39%) In his example
http://philosophicaleconomics.files.wordpress.com/2014/05/divg1.jpg
' no new funds were employed, but if one was to purchase $10000 worth of the index each year beginning in 2015 by 2035 the crash scenario would pull ahead 1,393,585 to 1,348,600. In 2044 the result would be 66%-crash 3,352,009; 200%-melt-up 1,822,286. In my real world example the combination of dividend reinvestment and dollar cost averaging generated higher returns for the 1929-1959 period.
Also this from
http://awealthofcommonsense.com/worlds-worst-market-timer/
What if You Only Invested at Market Peaks?
Posted on February 25, 2014
“Warren [Buffett], it strikes me that if you did nothing else you never sell. That is, if you can grit your teeth through and just disregard short-term declines in the market or even long-term declines in the market, you will come out well. I mean you just stick all your money in stocks and go home and don’t look at your portfolio you’ll do far better than if you try to trade it.” – Alan Greenspan
Meet Bob.
Bob is the world’s worst market timer.
What follows is Bob’s tale of terrible timing of his stock purchases.
Bob began his career in 1970 at age 22. He was a diligent saver and planner.
His plan was to save $2,000 a year during the 1970s and bump that amount up by $2,000 each decade until he could retire at age 65 by the end of 2013 (so $4,000/year in the 80s, $6,000/year in the 90s then $8,000/year until he retired).
He started out by saving the $2,000 a year in his bank account until he had $6,000 to invest by the end of 1972.
Bob’s problem as an investor was that he only had the courage to put his money to work in the market after a huge run up.
So all of his money went into an S&P 500 index fund at the end of 1972 (I know there were no index funds in 1972, but just go with me here…see my assumptions at the bottom of the post).
The market dropped nearly 50% in 1973-74 so Bob basically put his money in at the peak of the market right before a crash.
Yet he did have one saving grace. Once he was in the market, he never sold his fund shares. He held on for dear life because he was too nervous about being wrong on both his sell decisions too.
Remember this decision because it’s a big one.
Bob didn’t feel comfortable about investing again until August of 1987 after another huge bull market. After 15 years of saving he had $46,000 to put to work. Again he put it in an S&P 500 index fund and again he invested at a market peak just before a crash.
This time the market lost more than 30% in short order right after Bob bought his index shares.
Timing wasn’t on Bob’s side so he continued to keep his money invested as he did before.
After the 1987 crash Bob didn’t feel right about putting his future savings back into stocks until the tech bubble really ramped up at the end of 1999. He had another $68,000 of savings to put to work. This time his purchase at the end of December in 1999 was just before a 50%+ downturn that lasted until 2002.
This buy decision left Bob with some more scars but he decided to make one more big purchase with his savings before he retired.
The final investment was made in October of 2007 when he invested $64,000 which he had been saving since 2000. He rounded out his string of horrific market timing calls by buying right before another 50%+ crash from the credit blow-up.
After the financial crisis he decided to continue to save his money in the bank (another $40,000) but kept his stock investments in the market until he retired at the end of 2013.
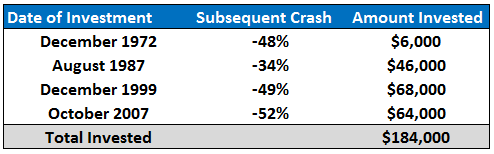
To recap, Bob was a terrible market timer with his only stock market purchases being made at the market peaks just before extreme losses.
Here are the purchase dates, the crashes that followed and the amount invested at each date:
http://awealthofcommonsense.com/wp-content/uploads/2014/02/mkt-timer.png
Luckily, while Bob couldn’t time his buys, he never sold out of the market even once. He didn’t sell after the bear market of 1973-74 or the Black Monday in 1987 or the technology bust in 2000 or the financial crisis of 2007-09.
He never sold a single share.
So how did he do?
Even though he only bought at the very top of the market, Bob still ended up a millionaire with $1.1 million.
How could that be you might ask?
First of all Bob was a diligent saver and planned out his savings in advance. He never wavered on his savings goals and increased the amount he saved over time.
Second, he allowed his investments to compound through the decades by never selling out of the market over his 40+ years of investing. He gave himself a really long runway.
He did have to endure a huge psychological toll from seeing large losses and sticking with his long-term mindset, but I like to think Bob didn’t pay much attention to his portfolio statements over the years. He just continued to save and kept his head down.
And finally, he had a very simple and low cost investment plan — one index fund with minimal costs.
Obviously, this story was for illustrative purposes and I wouldn’t recommend a portfolio consisting of 100% in stocks of a single market like the S&P 500 unless you have an extremely high risk tolerance. Even then a more balanced portfolio in different global markets with a sound rebalancing policy makes much more sense.
And if he would have simply dollar cost averaged into the market on an annual basis with his savings he would have ended up with much more money in the end (over $2.3 million).
But then he wouldn’t be Bob, The World’s Worst Market Timer.
Lessons from Bob’s Journey:
If you are going to make investment mistakes, make sure you are biased towards optimism and not pessimism. Long-term thinking has been rewarded in the past and unless you think the world or innovation is coming to an end it should be rewarded in the future. As Winston Churchill once said, “I am an optimist. It does not seem too much use being anything else.”
Losses are part of the deal when investing in stocks. How you react to those losses is one of the biggest determinants of your investment performance.
Saving more, thinking long-term and allowing compound interest to work in your favor are your biggest accelerants for building wealth. These factors have nothing to do with picking stocks or a complex investment strategy. Get these big things right and any disciplined investment strategy should do the trick.